JFreeChart - Graphique à bulles
Ce chapitre montre comment utiliser JFreeChart pour créer Bubble Chartà partir d'un ensemble donné de données commerciales. Un graphique à bulles affiche les informations en trois dimensions. Une bulle est tracée à l'endroit où les coordonnées (x, y) se croisent. La taille de la bulle est considérée comme la plage ou la quantité des axes X et Y.
Données d'entreprise
Considérons différentes personnes avec leur âge, leur poids et leurs capacités de travail. La capacité du wok peut être traitée comme un nombre d'heures qui est représenté sous forme de bulles dans le graphique.
| POIDS | ||||||||
|---|---|---|---|---|---|---|---|---|
| AGE | 30 | 40 | 50 | 60 | 70 | 80 | ||
| dix | 4 | WORK | ||||||
| 20 | 5 | |||||||
| 30 | dix | |||||||
| 40 | 8 | |||||||
| 50 | 9 | |||||||
| 60 | 6 | |||||||
Application basée sur AWT
Voici le code pour créer un graphique à bulles à partir des informations ci-dessus. Ce code vous aide à intégrer un graphique à bulles dans n'importe quelle application basée sur AWT.
import java.awt.Color;
import java.awt.Dimension;

import javax.swing.JPanel;

import org.jfree.chart.*;
import org.jfree.chart.axis.NumberAxis;
import org.jfree.chart.plot.PlotOrientation;
import org.jfree.chart.plot.XYPlot;
import org.jfree.chart.renderer.xy.XYItemRenderer;
import org.jfree.data.xy.DefaultXYZDataset;
import org.jfree.data.xy.XYZDataset;
import org.jfree.ui.ApplicationFrame;
import org.jfree.ui.RefineryUtilities;

public class BubbleChart_AWT extends ApplicationFrame {

   public BubbleChart_AWT( String s ) {
      super( s );
      JPanel jpanel = createDemoPanel( );
      jpanel.setPreferredSize(new Dimension( 560 , 370 ) );
      setContentPane( jpanel );
   }

   private static JFreeChart createChart( XYZDataset xyzdataset ) {
      JFreeChart jfreechart = ChartFactory.createBubbleChart(
         "AGE vs WEIGHT vs WORK",
         "Weight",
         "AGE",
         xyzdataset,
         PlotOrientation.HORIZONTAL,
         true, true, false);

      XYPlot xyplot = ( XYPlot )jfreechart.getPlot( );
      xyplot.setForegroundAlpha( 0.65F );
      XYItemRenderer xyitemrenderer = xyplot.getRenderer( );
      xyitemrenderer.setSeriesPaint( 0 , Color.blue );
      NumberAxis numberaxis = ( NumberAxis )xyplot.getDomainAxis( );
      numberaxis.setLowerMargin( 0.2 );
      numberaxis.setUpperMargin( 0.5 );
      NumberAxis numberaxis1 = ( NumberAxis )xyplot.getRangeAxis( );
      numberaxis1.setLowerMargin( 0.8 );
      numberaxis1.setUpperMargin( 0.9 );

      return jfreechart;
   }

   public static XYZDataset createDataset( ) {
      DefaultXYZDataset defaultxyzdataset = new DefaultXYZDataset();
      double ad[ ] = { 30 , 40 , 50 , 60 , 70 , 80 };
      double ad1[ ] = { 10 , 20 , 30 , 40 , 50 , 60 };
      double ad2[ ] = { 4 , 5 , 10 , 8 , 9 , 6 };
      double ad3[][] = { ad , ad1 , ad2 };
      defaultxyzdataset.addSeries( "Series 1" , ad3 );

      return defaultxyzdataset;
   }

   public static JPanel createDemoPanel( ) {
      JFreeChart jfreechart = createChart( createDataset( ) );
      ChartPanel chartpanel = new ChartPanel( jfreechart );

      chartpanel.setDomainZoomable( true );
      chartpanel.setRangeZoomable( true );

      return chartpanel;
   }

   public static void main( String args[ ] ) {
      BubbleChart_AWT bubblechart = new BubbleChart_AWT( "Bubble Chart_frame" );
      bubblechart.pack( );
      RefineryUtilities.centerFrameOnScreen( bubblechart );
      bubblechart.setVisible( true );
   }
}
Gardons le code Java ci-dessus dans BubbleChart_AWT.java fichier, puis compilez et exécutez-le à partir de la commande invitée comme -
$javac BubbleChart_AWT.java
$java BubbleChart_AW
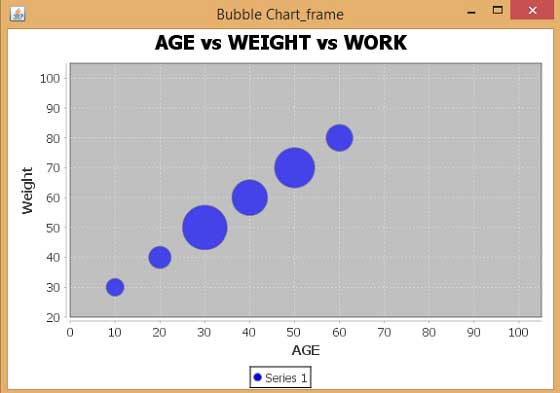
Si tout va bien, il sera compilé et exécuté pour générer le graphique à bulles suivant -

Création d'images JPEG
Réécrivons l'exemple ci-dessus pour générer une image JPEG à partir d'une ligne de commande.
import java.io.*;

import java.awt.Color;

import org.jfree.chart.*;
import org.jfree.chart.axis.NumberAxis;
import org.jfree.chart.plot.PlotOrientation;
import org.jfree.chart.plot.XYPlot;
import org.jfree.chart.renderer.xy.XYItemRenderer;
import org.jfree.data.xy.DefaultXYZDataset;
import org.jfree.chart.ChartUtilities;

public class BubbleChart_image {

   public static void main( String args[ ] )throws Exception {
      DefaultXYZDataset defaultxyzdataset = new DefaultXYZDataset( );
      double ad[ ] = { 30 , 40 , 50 , 60 , 70 , 80 };
      double ad1[ ] = { 10 , 20 , 30 , 40 , 50 , 60 };
      double ad2[ ] = { 4 , 5 , 10 , 8 , 9 , 6 };
      double ad3[ ][ ] = { ad , ad1 , ad2 };
      defaultxyzdataset.addSeries( "Series 1" , ad3 );

      JFreeChart jfreechart = ChartFactory.createBubbleChart(
         "AGE vs WEIGHT vs WORK",
         "Weight",
         "AGE",
         defaultxyzdataset,
         PlotOrientation.HORIZONTAL,
         true, true, false);

      XYPlot xyplot = ( XYPlot )jfreechart.getPlot( );
      xyplot.setForegroundAlpha( 0.65F );
      XYItemRenderer xyitemrenderer = xyplot.getRenderer( );
      xyitemrenderer.setSeriesPaint( 0 , Color.blue );
      NumberAxis numberaxis = ( NumberAxis )xyplot.getDomainAxis( );
      numberaxis.setLowerMargin( 0.2 );
      numberaxis.setUpperMargin( 0.5 );
      NumberAxis numberaxis1 = ( NumberAxis )xyplot.getRangeAxis( );
      numberaxis1.setLowerMargin( 0.8 );
      numberaxis1.setUpperMargin( 0.9 );

      int width = 560;   /* Width of the image */
      int height = 370;  /* Height of the image */
      File bubbleChart = new File("BubbleChart.jpeg");
      ChartUtilities.saveChartAsJPEG(bubbleChart,jfreechart,width,height);
   }
}
Gardons le code Java ci-dessus dans BubbleChart_image.java fichier, puis compilez et exécutez-le à partir de la commande invitée comme -
$javac BubbleChart_image.java
$java BubbleChart_image
Si tout va bien, il se compilera et s'exécutera pour créer un fichier image JPEG nommé BubbleChart.jpeg dans votre répertoire actuel.