JFreeChart - बबल चार्ट
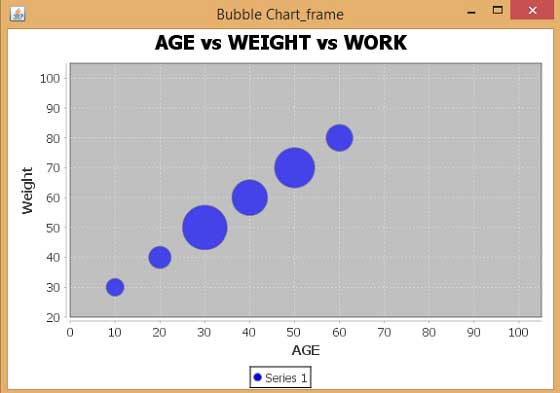
यह अध्याय दर्शाता है कि आप JFreeChart का उपयोग कैसे कर सकते हैं Bubble Chartव्यवसाय डेटा के दिए गए सेट से। एक बबल चार्ट तीन आयामी तरीके से जानकारी प्रदर्शित करता है। एक बुलबुला उस जगह पर प्लॉट किया जाता है, जहां (x, y) इंटरसेक्ट को समन्वयित करता है। बुलबुले के आकार को एक्स या वाई अक्ष की सीमा या मात्रा के रूप में माना जाता है।
व्यापार डेटा
आइए हम विभिन्न व्यक्तियों के साथ उनकी आयु, वजन और कार्य क्षमता पर विचार करें। वोक क्षमता को उन घंटों की संख्या के रूप में माना जा सकता है जिन्हें चार्ट में बुलबुले के रूप में प्लॉट किया गया है।
| वजन | ||||||||
|---|---|---|---|---|---|---|---|---|
| AGE | 30 | 40 | 50 | 60 | 70 | 80 | ||
| 10 | 4 | WORK | ||||||
| 20 | 5 | |||||||
| 30 | 10 | |||||||
| 40 | 8 | |||||||
| 50 | 9 | |||||||
| 60 | 6 | |||||||
AWT आधारित अनुप्रयोग
ऊपर दी गई जानकारी से बबल चार्ट बनाने के लिए कोड निम्नलिखित है। यह कोड आपको किसी भी AWT आधारित एप्लिकेशन में बबल चार्ट को एम्बेड करने में मदद करता है।
import java.awt.Color;
import java.awt.Dimension;

import javax.swing.JPanel;

import org.jfree.chart.*;
import org.jfree.chart.axis.NumberAxis;
import org.jfree.chart.plot.PlotOrientation;
import org.jfree.chart.plot.XYPlot;
import org.jfree.chart.renderer.xy.XYItemRenderer;
import org.jfree.data.xy.DefaultXYZDataset;
import org.jfree.data.xy.XYZDataset;
import org.jfree.ui.ApplicationFrame;
import org.jfree.ui.RefineryUtilities;

public class BubbleChart_AWT extends ApplicationFrame {

   public BubbleChart_AWT( String s ) {
      super( s );
      JPanel jpanel = createDemoPanel( );
      jpanel.setPreferredSize(new Dimension( 560 , 370 ) );
      setContentPane( jpanel );
   }

   private static JFreeChart createChart( XYZDataset xyzdataset ) {
      JFreeChart jfreechart = ChartFactory.createBubbleChart(
         "AGE vs WEIGHT vs WORK",
         "Weight",
         "AGE",
         xyzdataset,
         PlotOrientation.HORIZONTAL,
         true, true, false);

      XYPlot xyplot = ( XYPlot )jfreechart.getPlot( );
      xyplot.setForegroundAlpha( 0.65F );
      XYItemRenderer xyitemrenderer = xyplot.getRenderer( );
      xyitemrenderer.setSeriesPaint( 0 , Color.blue );
      NumberAxis numberaxis = ( NumberAxis )xyplot.getDomainAxis( );
      numberaxis.setLowerMargin( 0.2 );
      numberaxis.setUpperMargin( 0.5 );
      NumberAxis numberaxis1 = ( NumberAxis )xyplot.getRangeAxis( );
      numberaxis1.setLowerMargin( 0.8 );
      numberaxis1.setUpperMargin( 0.9 );

      return jfreechart;
   }

   public static XYZDataset createDataset( ) {
      DefaultXYZDataset defaultxyzdataset = new DefaultXYZDataset();
      double ad[ ] = { 30 , 40 , 50 , 60 , 70 , 80 };
      double ad1[ ] = { 10 , 20 , 30 , 40 , 50 , 60 };
      double ad2[ ] = { 4 , 5 , 10 , 8 , 9 , 6 };
      double ad3[][] = { ad , ad1 , ad2 };
      defaultxyzdataset.addSeries( "Series 1" , ad3 );

      return defaultxyzdataset;
   }

   public static JPanel createDemoPanel( ) {
      JFreeChart jfreechart = createChart( createDataset( ) );
      ChartPanel chartpanel = new ChartPanel( jfreechart );

      chartpanel.setDomainZoomable( true );
      chartpanel.setRangeZoomable( true );

      return chartpanel;
   }

   public static void main( String args[ ] ) {
      BubbleChart_AWT bubblechart = new BubbleChart_AWT( "Bubble Chart_frame" );
      bubblechart.pack( );
      RefineryUtilities.centerFrameOnScreen( bubblechart );
      bubblechart.setVisible( true );
   }
}
आइए हम उपरोक्त जावा कोड को अंदर रखते हैं BubbleChart_AWT.java फ़ाइल, और फिर संकलित करें और इसे कमांड से चलाएं जैसे कि -
$javac BubbleChart_AWT.java
$java BubbleChart_AW
यदि सब कुछ ठीक है, तो यह निम्नलिखित बबल ग्राफ को उत्पन्न करने के लिए संकलित करेगा और चलाएगा -
JPEG छवि निर्माण
कमांड लाइन से JPEG इमेज जेनरेट करने के लिए उपरोक्त उदाहरण को फिर से लिखते हैं।
import java.io.*;

import java.awt.Color;

import org.jfree.chart.*;
import org.jfree.chart.axis.NumberAxis;
import org.jfree.chart.plot.PlotOrientation;
import org.jfree.chart.plot.XYPlot;
import org.jfree.chart.renderer.xy.XYItemRenderer;
import org.jfree.data.xy.DefaultXYZDataset;
import org.jfree.chart.ChartUtilities;

public class BubbleChart_image {

   public static void main( String args[ ] )throws Exception {
      DefaultXYZDataset defaultxyzdataset = new DefaultXYZDataset( );
      double ad[ ] = { 30 , 40 , 50 , 60 , 70 , 80 };
      double ad1[ ] = { 10 , 20 , 30 , 40 , 50 , 60 };
      double ad2[ ] = { 4 , 5 , 10 , 8 , 9 , 6 };
      double ad3[ ][ ] = { ad , ad1 , ad2 };
      defaultxyzdataset.addSeries( "Series 1" , ad3 );

      JFreeChart jfreechart = ChartFactory.createBubbleChart(
         "AGE vs WEIGHT vs WORK",
         "Weight",
         "AGE",
         defaultxyzdataset,
         PlotOrientation.HORIZONTAL,
         true, true, false);

      XYPlot xyplot = ( XYPlot )jfreechart.getPlot( );
      xyplot.setForegroundAlpha( 0.65F );
      XYItemRenderer xyitemrenderer = xyplot.getRenderer( );
      xyitemrenderer.setSeriesPaint( 0 , Color.blue );
      NumberAxis numberaxis = ( NumberAxis )xyplot.getDomainAxis( );
      numberaxis.setLowerMargin( 0.2 );
      numberaxis.setUpperMargin( 0.5 );
      NumberAxis numberaxis1 = ( NumberAxis )xyplot.getRangeAxis( );
      numberaxis1.setLowerMargin( 0.8 );
      numberaxis1.setUpperMargin( 0.9 );

      int width = 560;   /* Width of the image */
      int height = 370;  /* Height of the image */
      File bubbleChart = new File("BubbleChart.jpeg");
      ChartUtilities.saveChartAsJPEG(bubbleChart,jfreechart,width,height);
   }
}
आइए हम उपरोक्त जावा कोड को अंदर रखते हैं BubbleChart_image.java फ़ाइल, और फिर संकलित करें और इसे कमांड से चलाएं जैसे कि -
$javac BubbleChart_image.java
$java BubbleChart_image
यदि सब कुछ ठीक है, तो यह JPEG छवि फ़ाइल नाम बनाने के लिए संकलित और चलाने के लिए होगा BubbleChart.jpeg अपनी वर्तमान निर्देशिका में।