AngularHighcharts-散布図
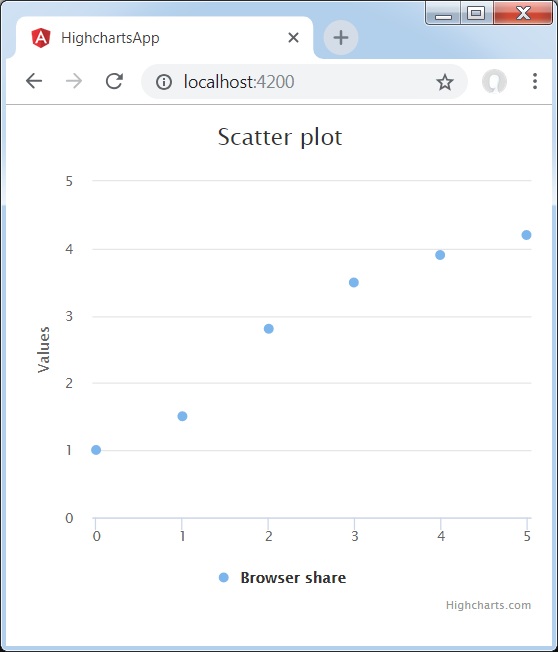
以下は、基本的な散布図の例です。
ハイチャート構成構文の章で、チャートの描画に使用される構成についてはすでに説明しました。
基本的な散布図の例を以下に示します。
構成
ここで、追加の構成/手順を見てみましょう。
シリーズ
チャートタイプを分散ベースに構成します。 series.typeチャートのシリーズタイプを決定します。ここで、デフォルト値は「line」です。
var chart = {
   type: 'scatter',
   zoomType: 'xy'
};
例
app.component.ts
import { Component } from '@angular/core';
import * as Highcharts from 'highcharts';
@Component({
  selector: 'app-root',
  templateUrl: './app.component.html',
  styleUrls: ['./app.component.css']
})
export class AppComponent {
   highcharts = Highcharts;
   chartOptions = {
      title : {
         text: 'Scatter plot'
      },
      series : [{
         type: 'scatter',
         zoomType:'xy',
         name: 'Browser share',
         data: [ 1, 1.5, 2.8, 3.5, 3.9, 4.2 ]
      }]
   };
}
結果
結果を確認します。