GWT Google Charts - Организационная структура
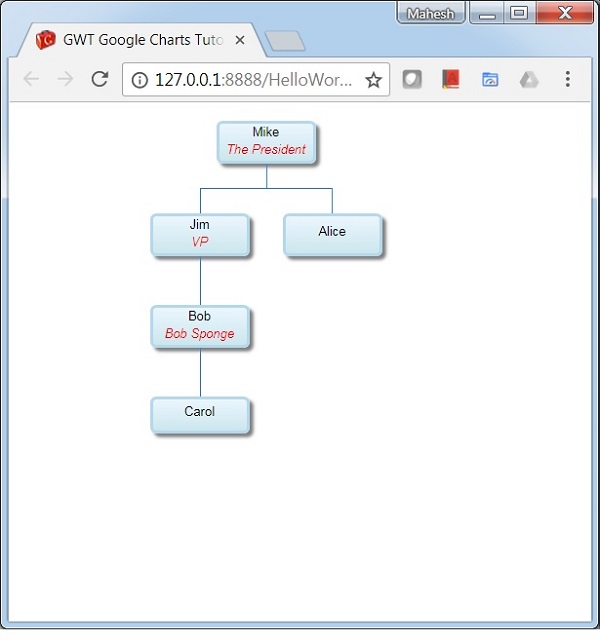
Ниже приведен пример организационной схемы.
Организационная диаграмма помогает в отображении иерархии узлов, используемых для изображения отношений высшего и подчиненного уровня в организации. Например, генеалогическое древо - это разновидность организационной схемы. Мы уже видели конфигурации, используемые для рисования диаграммы в главе Синтаксис конфигурации Google Charts . Теперь давайте посмотрим на пример организационной схемы.
Конфигурации
Мы использовали OrgChart класс, чтобы показать диаграмму организации.
// Organization chart
OrgChart chart = new OrgChart();
пример
HelloWorld.java
package com.tutorialspoint.client;

import com.google.gwt.core.client.EntryPoint;
import com.google.gwt.user.client.ui.RootPanel;

import com.googlecode.gwt.charts.client.ChartLoader;
import com.googlecode.gwt.charts.client.ChartPackage;
import com.googlecode.gwt.charts.client.ColumnType;
import com.googlecode.gwt.charts.client.DataTable;
import com.googlecode.gwt.charts.client.format.PatternFormat;
import com.googlecode.gwt.charts.client.orgchart.OrgChart;
import com.googlecode.gwt.charts.client.orgchart.OrgChartOptions;

public class HelloWorld implements EntryPoint {
   private OrgChart chart;

   private void initialize() {
      ChartLoader chartLoader = new ChartLoader(ChartPackage.ORGCHART);
      chartLoader.loadApi(new Runnable() {
         public void run() {
            // Create and attach the chart
            chart = new OrgChart();
            RootPanel.get().add(chart);
            draw();
         }
      });
   }
   private void draw() {
      // Prepare the data
      DataTable dataTable = DataTable.create();
      dataTable.addColumn(ColumnType.STRING, "Name");
      dataTable.addColumn(ColumnType.STRING, "Manager");
      dataTable.addColumn(ColumnType.STRING, "ToolTip");
      dataTable.addRows(5);

      dataTable.setValue(0, 0, "Mike");
      dataTable.setValue(0, 1, "");
      dataTable.setValue(0, 2, "The President");
      dataTable.setValue(1, 0, "Jim");
      dataTable.setValue(1, 1, "Mike");
      dataTable.setValue(1, 2, "VP");
      dataTable.setValue(2, 0, "Alice");
      dataTable.setValue(2, 1, "Mike");
      dataTable.setValue(2, 2, "");
      dataTable.setValue(3, 0, "Bob");
      dataTable.setValue(3, 1, "Jim");
      dataTable.setValue(3, 2, "Bob Sponge");
      dataTable.setValue(4, 0, "Carol");
      dataTable.setValue(4, 1, "Bob");
      dataTable.setValue(4, 2, "");

      PatternFormat format = PatternFormat.create("{0} {1}");
      format.format(dataTable, 0, 2);

      // Set options
      OrgChartOptions options = OrgChartOptions.create();
      options.setAllowHtml(true);

      // Draw the chart
      chart.draw(dataTable, options);
      chart.setWidth("400px");
      chart.setHeight("400px");
   }
   public void onModuleLoad() {
      initialize();
   }
}
Результат
Проверьте результат.
