GWT Google Charts - Dağılım Grafiği
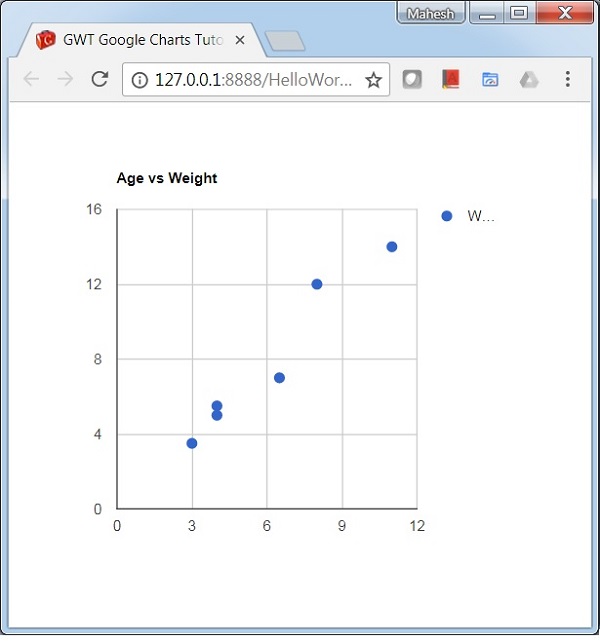
Aşağıda bir Dağılım Grafiği örneği verilmiştir.
Google Grafik Yapılandırma Sözdizimi bölümünde bir grafik çizmek için kullanılan yapılandırmaları daha önce görmüştük . Şimdi bir Dağılım Grafiği örneğini görelim.
Konfigürasyonlar
Kullandık ScatterChart Scatter grafiğini göstermek için sınıf.
ScatterChart chart = new ScatterChart();Misal
HelloWorld.java
package com.tutorialspoint.client;

import com.google.gwt.core.client.EntryPoint;
import com.google.gwt.user.client.ui.RootPanel;

import com.googlecode.gwt.charts.client.ChartLoader;
import com.googlecode.gwt.charts.client.ChartPackage;
import com.googlecode.gwt.charts.client.ColumnType;
import com.googlecode.gwt.charts.client.DataTable;
import com.googlecode.gwt.charts.client.corechart.ScatterChart;
import com.googlecode.gwt.charts.client.corechart.ScatterChartOptions;

public class HelloWorld implements EntryPoint {
   private ScatterChart chart;

   private void initialize() {
      ChartLoader chartLoader = new ChartLoader(ChartPackage.CORECHART);
      chartLoader.loadApi(new Runnable() {
         public void run() {
            // Create and attach the chart
            chart = new ScatterChart();
            RootPanel.get().add(chart);
            draw();
         }
      });
   }
   private void draw() {
      // Prepare the data
      DataTable data = DataTable.create();
      data.addColumn(ColumnType.NUMBER, "Age");
      data.addColumn(ColumnType.NUMBER, "Weight");

      data.addRow(8,12);
      data.addRow(4, 5.5);
      data.addRow(11,14);
      data.addRow(4,5);
      data.addRow(3,3.5);
      data.addRow(6.5,7);

      ScatterChartOptions options  = ScatterChartOptions.create();
      options.setTitle("Age vs Weight");
      options.setLegend(null);

      // Draw the chart
      chart.draw(data, options);
      chart.setWidth("400px");
      chart.setHeight("400px");
   }
   public void onModuleLoad() {
      initialize();
   }
}
Sonuç
Sonucu doğrulayın.
