Matplotlib - İkiz Eksenler
Bir şekilde çift x veya y eksenine sahip olmanın yararlı olduğu düşünülmektedir. Moreso, farklı birimlerle birlikte eğrileri çizerken. Matplotlib bunu twinx ve twiny işlevleriyle destekler.
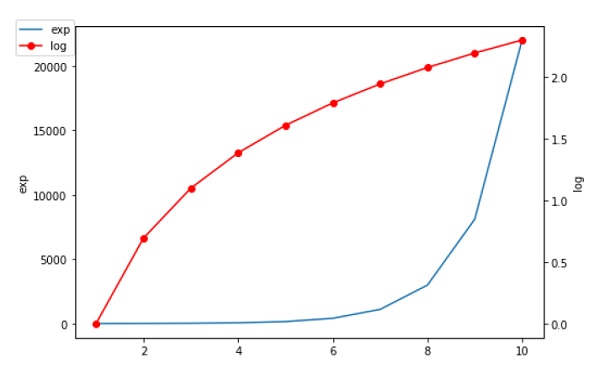
Aşağıdaki örnekte, grafiğin ikili y ekseni vardır, biri exp (x), diğeri log (x) -
import matplotlib.pyplot as plt
import numpy as np
fig = plt.figure()
a1 = fig.add_axes([0,0,1,1])
x = np.arange(1,11)
a1.plot(x,np.exp(x))
a1.set_ylabel('exp')
a2 = a1.twinx()
a2.plot(x, np.log(x),'ro-')
a2.set_ylabel('log')
fig.legend(labels = ('exp','log'),loc='upper left')
plt.show()