NumPy - Matplotlib
Matplotlib, Python için bir çizim kitaplığıdır. MatLab için etkili bir açık kaynak alternatifi olan bir ortam sağlamak için NumPy ile birlikte kullanılır. PyQt ve wxPython gibi grafik araç takımlarıyla da kullanılabilir.
Matplotlib modülü ilk olarak John D. Hunter tarafından yazılmıştır. Michael Droettboom, 2012'den beri ana geliştiricidir. Şu anda, Matplotlib ver. 1.5.1 mevcut kararlı sürümdür. Paket, ikili dağıtımda ve www.matplotlib.org adresindeki kaynak kodu formunda mevcuttur .
Geleneksel olarak, paket aşağıdaki ifade eklenerek Python betiğine aktarılır -
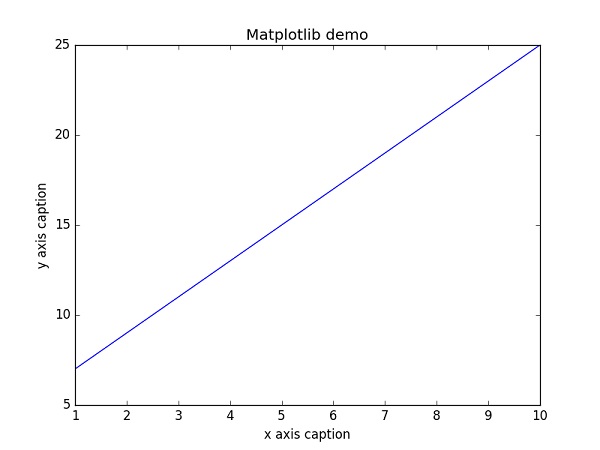
from matplotlib import pyplot as pltBuraya pyplot()2 boyutlu verileri çizmek için kullanılan matplotlib kütüphanesindeki en önemli işlevdir. Aşağıdaki komut dosyası denklemi çiziyory = 2x + 5
Misal
import numpy as np
from matplotlib import pyplot as plt

x = np.arange(1,11)
y = 2 * x + 5
plt.title("Matplotlib demo")
plt.xlabel("x axis caption")
plt.ylabel("y axis caption")
plt.plot(x,y)
plt.show()
Bir ndarray nesnesi x oluşturulur. np.arange() function üzerindeki değerler olarak x axis. İlgili değerlery axis başka bir yerde saklanır ndarray object y. Bu değerler kullanılarak çizilirplot() matplotlib paketinin pyplot alt modülünün işlevi.
Grafik gösterimi şu şekilde görüntülenir: show() işlevi.
Yukarıdaki kod aşağıdaki çıktıyı üretmelidir -
Doğrusal grafik yerine, değerler, bir biçim dizesi eklenerek ayrı ayrı görüntülenebilir. plot()işlevi. Aşağıdaki biçimlendirme karakterleri kullanılabilir.
| Sr.No. | Karakter açıklaması |
|---|---|
| 1 | '-' Düz çizgi stili |
| 2 | '--' Kesikli çizgi stili |
| 3 | '-.' Kısa çizgi çizgi stili |
| 4 | ':' Noktalı çizgi stili |
| 5 | '.' Nokta işaretçisi |
| 6 | ',' Piksel işaretçisi |
| 7 | 'o' Daire işaretçisi |
| 8 | 'v' Triangle_down işaretçisi |
| 9 | '^' Triangle_up işaretçisi |
| 10 | '<' Triangle_left işaretçisi |
| 11 | '>' Triangle_right işaretçisi |
| 12 | '1' Tri_down işaretçisi |
| 13 | '2' Tri_up işaretçisi |
| 14 | '3' Tri_left işaretçisi |
| 15 | '4' Tri_right işaretçisi |
| 16 | 's' Kare işaretçi |
| 17 | 'p' Pentagon işaretçisi |
| 18 | '*' Yıldız işaretçisi |
| 19 | 'h' Hexagon1 işaretçisi |
| 20 | 'H' Hexagon2 işaretçisi |
| 21 | '+' Artı işaretçisi |
| 22 | 'x' X işaretçisi |
| 23 | 'D' Elmas işaretleyici |
| 24 | 'd' Thin_diamond işaretleyici |
| 25 | '|' Vline işaretçisi |
| 26 | '_' Hline işaretçisi |
Aşağıdaki renk kısaltmaları da tanımlanmıştır.
| Karakter | Renk |
|---|---|
| 'b' | Mavi |
| 'g' | Yeşil |
| 'r' | Kırmızı |
| 'c' | Mavi |
| 'm' | Eflatun |
| "y" | Sarı |
| 'k' | Siyah |
| 'w' | Beyaz |
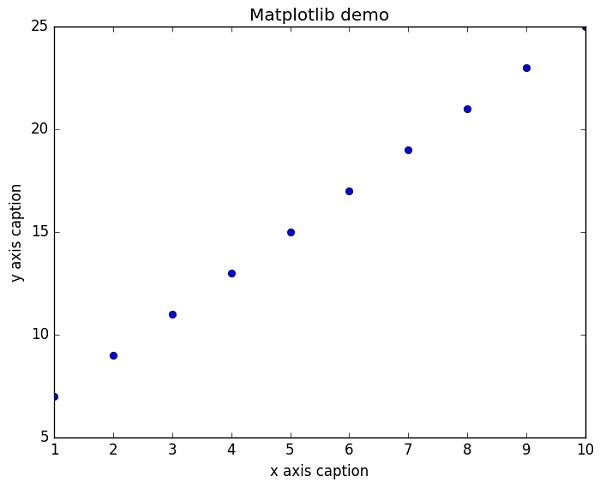
Noktaları temsil eden daireleri yukarıdaki örnekte çizgi yerine görüntülemek için kullanın “ob” plot () işlevindeki biçim dizesi olarak.
Misal
import numpy as np
from matplotlib import pyplot as plt

x = np.arange(1,11)
y = 2 * x + 5
plt.title("Matplotlib demo")
plt.xlabel("x axis caption")
plt.ylabel("y axis caption")
plt.plot(x,y,"ob")
plt.show()
Yukarıdaki kod aşağıdaki çıktıyı üretmelidir -
Sinüs Dalgası Grafiği
Aşağıdaki komut dosyası, sine wave plot matplotlib kullanarak.
Misal
import numpy as np
import matplotlib.pyplot as plt

# Compute the x and y coordinates for points on a sine curve
x = np.arange(0, 3 * np.pi, 0.1)
y = np.sin(x)
plt.title("sine wave form")

# Plot the points using matplotlib
plt.plot(x, y)
plt.show()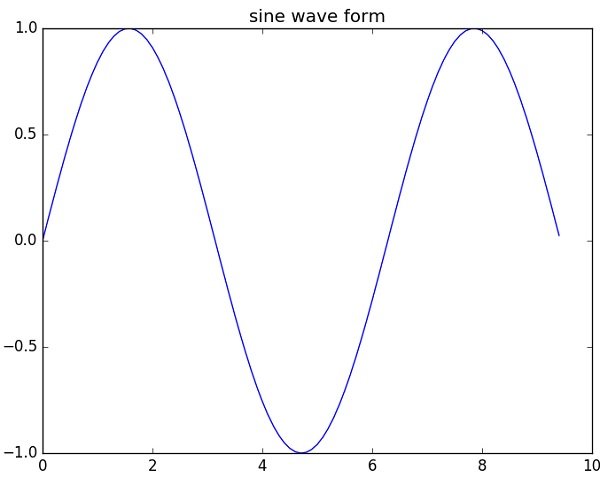
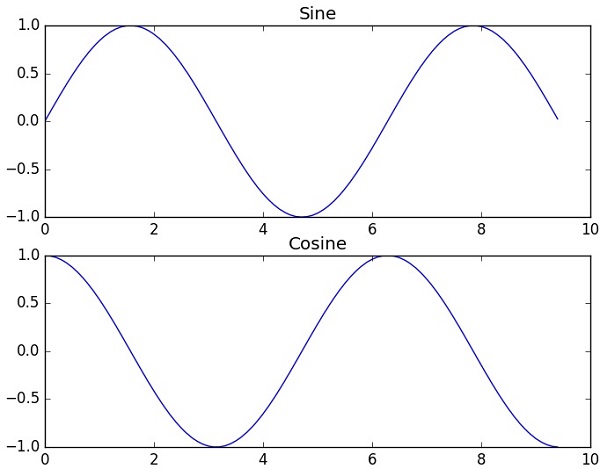
alt plan ()
Subplot () işlevi, aynı şekilde farklı şeyler çizmenize izin verir. Aşağıdaki komut dosyasında,sine ve cosine values çizilmiştir.
Misal
import numpy as np
import matplotlib.pyplot as plt

# Compute the x and y coordinates for points on sine and cosine curves
x = np.arange(0, 3 * np.pi, 0.1)
y_sin = np.sin(x)
y_cos = np.cos(x)

# Set up a subplot grid that has height 2 and width 1,
# and set the first such subplot as active.
plt.subplot(2, 1, 1)

# Make the first plot
plt.plot(x, y_sin)
plt.title('Sine')

# Set the second subplot as active, and make the second plot.
plt.subplot(2, 1, 2)
plt.plot(x, y_cos)
plt.title('Cosine')

# Show the figure.
plt.show()
Yukarıdaki kod aşağıdaki çıktıyı üretmelidir -
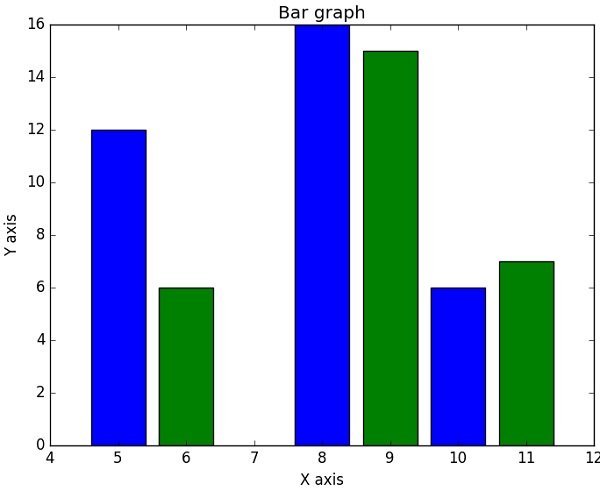
bar()
pyplot submodule sağlar bar()çubuk grafikler oluşturma işlevi. Aşağıdaki örnek, iki setin çubuk grafiğini oluşturur.x ve y diziler.
Misal
from matplotlib import pyplot as plt
x = [5,8,10]
y = [12,16,6]

x2 = [6,9,11]
y2 = [6,15,7]
plt.bar(x, y, align = 'center')
plt.bar(x2, y2, color = 'g', align = 'center')
plt.title('Bar graph')
plt.ylabel('Y axis')
plt.xlabel('X axis')

plt.show()
Bu kod aşağıdaki çıktıyı üretmelidir -