GWT Highcharts - Cú pháp cấu hình
Trong chương này, chúng tôi sẽ giới thiệu cấu hình cần thiết để vẽ biểu đồ bằng cách sử dụng API Highcharts trong GWT.
Bước 1: Tạo ứng dụng GWT
Làm theo các bước sau để cập nhật ứng dụng GWT mà chúng tôi đã tạo trong GWT - Chương Tạo ứng dụng -
| Bươc | Sự miêu tả |
|---|---|
| 1 | Tạo một dự án với tên HelloWorld trong một gói com.tutorialspoint như được giải thích trong chương GWT - Tạo ứng dụng . |
| 2 | Sửa đổi HelloWorld.gwt.xml , HelloWorld.html và HelloWorld.java như được giải thích bên dưới. Giữ phần còn lại của các tệp không thay đổi. |
| 3 | Biên dịch và chạy ứng dụng để xác minh kết quả của logic được triển khai. |
Sau đây là nội dung của bộ mô tả mô-đun đã sửa đổi src/com.tutorialspoint/HelloWorld.gwt.xml.
<?xml version = "1.0" encoding = "UTF-8"?>
<module rename-to = 'helloworld'>
   <inherits name = 'com.google.gwt.user.User'/>
   <inherits name = 'com.google.gwt.user.theme.clean.Clean'/>
   <entry-point class = 'com.tutorialspoint.client.HelloWorld'/>
   <inherits name="org.moxieapps.gwt.highcharts.Highcharts"/>
   <source path = 'client'/>
   <source path = 'shared'/>
</module>
Sau đây là nội dung của tệp máy chủ HTML đã sửa đổi war/HelloWorld.html.
<html>
   <head>
      <title>GWT Highcharts Showcase</title>
      <link rel = "stylesheet" href = "HelloWorld.css"/>
      <script language = "javascript" src = "helloworld/helloworld.nocache.js">
         <script src = "https://ajax.googleapis.com/ajax/libs/jquery/2.1.3/jquery.min.js" />
         <script src = "https://code.highcharts.com/highcharts.js" />
      </script>
   </head>
   <body>
   </body>
</html>
Cuối cùng, chúng ta sẽ thấy HelloWorld.java được cập nhật sau khi hiểu cấu hình.
Bước 2: Tạo cấu hình
Tạo biểu đồ
Định cấu hình loại, tiêu đề và tiêu đề phụ của biểu đồ.
Chart chart = new Chart()
   .setType(Type.SPLINE)
   .setChartTitleText("Monthly Average Temperature")
   .setChartSubtitleText("Source: WorldClimate.com");
xAxis
Định cấu hình mã được hiển thị trên Trục X.
XAxis xAxis = chart.getXAxis();
xAxis.setCategories("Jan", "Feb", "Mar", "Apr", "May", "Jun",
   "Jul", "Aug", "Sep", "Oct", "Nov", "Dec");
yAxis
Định cấu hình tiêu đề, các dòng cốt truyện sẽ hiển thị trên trục Y.
YAxis yAxis = chart.getYAxis();
yAxis.setAxisTitleText("Temperature °C");
yAxis.createPlotLine()
   .setValue(0)
   .setWidth(1)
   .setColor("#808080");
chú giải công cụ
Định cấu hình chú giải công cụ. Đặt hậu tố được thêm vào sau giá trị (trục y).
ToolTip toolTip = new ToolTip();
toolTip.setValueSuffix("°C");
chart.setToolTip(toolTip);
huyền thoại
Định cấu hình chú giải được hiển thị ở bên phải của biểu đồ cùng với các thuộc tính khác.
legend.setLayout(Legend.Layout.VERTICAL)
   .setAlign(Legend.Align.RIGHT)
   .setVerticalAlign(Legend.VerticalAlign.TOP)
   .setX(-10)
   .setY(100)
   .setBorderWidth(0);
chart.setLegend(legend);
loạt
Định cấu hình dữ liệu được hiển thị trên biểu đồ. Chuỗi là một mảng trong đó mỗi phần tử của mảng này đại diện cho một dòng duy nhất trên biểu đồ.
chart.addSeries(chart.createSeries()
   .setName("Tokyo")
   .setPoints(new Number[] {
      7.0, 6.9, 9.5, 14.5, 18.2, 21.5, 25.2,
      26.5, 23.3, 18.3, 13.9, 9.6
   })
);

chart.addSeries(chart.createSeries()
   .setName("New York")
   .setPoints(new Number[] {
      -0.2, 0.8, 5.7, 11.3, 17.0, 22.0, 24.8,
      24.1, 20.1, 14.1, 8.6, 2.5
   })
);

chart.addSeries(chart.createSeries()
   .setName("Berlin")
   .setPoints(new Number[] {
      -0.9, 0.6, 3.5, 8.4, 13.5, 17.0, 18.6,
      17.9, 14.3, 9.0, 3.9, 1.0
   })
);

chart.addSeries(chart.createSeries()
   .setName("London")
   .setPoints(new Number[] {
      3.9, 4.2, 5.7, 8.5, 11.9, 15.2, 17.0,
      16.6, 14.2, 10.3, 6.6, 4.8
   })
);
Bước 3: Thêm biểu đồ vào bảng điều khiển mẹ.
Chúng tôi đang thêm biểu đồ vào bảng điều khiển gốc.
RootPanel.get().add(chart);Thí dụ
Hãy xem xét ví dụ sau để hiểu thêm về Cú pháp cấu hình:
HelloWorld.java
package com.tutorialspoint.client;

import org.moxieapps.gwt.highcharts.client.Chart;
import org.moxieapps.gwt.highcharts.client.Legend;
import org.moxieapps.gwt.highcharts.client.Series.Type;
import org.moxieapps.gwt.highcharts.client.ToolTip;
import org.moxieapps.gwt.highcharts.client.XAxis;
import org.moxieapps.gwt.highcharts.client.YAxis;

import com.google.gwt.core.client.EntryPoint;
import com.google.gwt.user.client.ui.RootPanel;

public class HelloWorld implements EntryPoint {
   public void onModuleLoad() {
      Chart chart = new Chart()
         .setType(Type.SPLINE)
         .setChartTitleText("Monthly Average Temperature")
         .setChartSubtitleText("Source: WorldClimate.com");

      XAxis xAxis = chart.getXAxis();
      xAxis.setCategories("Jan", "Feb", "Mar", "Apr", "May", "Jun",
         "Jul", "Aug", "Sep", "Oct", "Nov", "Dec");

      YAxis yAxis = chart.getYAxis();
      yAxis.setAxisTitleText("Temperature °C");
      yAxis.createPlotLine()
         .setValue(0)
         .setWidth(1)
         .setColor("#808080");

      ToolTip toolTip = new ToolTip();
      toolTip.setValueSuffix("°C");
      chart.setToolTip(toolTip);

      Legend legend = new Legend();
      legend.setLayout(Legend.Layout.VERTICAL)
         .setAlign(Legend.Align.RIGHT)
         .setVerticalAlign(Legend.VerticalAlign.TOP)
         .setX(-10)
         .setY(100)
         .setBorderWidth(0);
      chart.setLegend(legend);

      chart.addSeries(chart.createSeries()
         .setName("Tokyo")
         .setPoints(new Number[] {
            7.0, 6.9, 9.5, 14.5, 18.2, 21.5, 25.2,
            26.5, 23.3, 18.3, 13.9, 9.6
         })
      );

      chart.addSeries(chart.createSeries()
         .setName("New York")
         .setPoints(new Number[] {
            -0.2, 0.8, 5.7, 11.3, 17.0, 22.0, 24.8,
            24.1, 20.1, 14.1, 8.6, 2.5
         })
      );

      chart.addSeries(chart.createSeries()
         .setName("Berlin")
         .setPoints(new Number[] {
            -0.9, 0.6, 3.5, 8.4, 13.5, 17.0, 18.6,
            17.9, 14.3, 9.0, 3.9, 1.0
         })
      );

      chart.addSeries(chart.createSeries()
         .setName("London")
         .setPoints(new Number[] {
            3.9, 4.2, 5.7, 8.5, 11.9, 15.2, 17.0,
            16.6, 14.2, 10.3, 6.6, 4.8
         })
      );
      RootPanel.get().add(chart);
   }
}
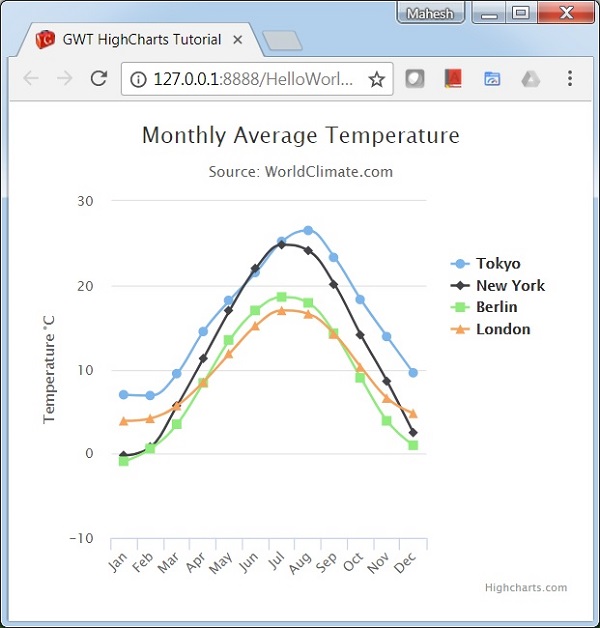
Kết quả
Xác minh kết quả.
