GWT Highcharts - कॉन्फ़िगरेशन सिंटैक्स
इस अध्याय में, हम GWT में Highcharts API का उपयोग करके एक चार्ट बनाने के लिए आवश्यक कॉन्फ़िगरेशन का प्रदर्शन करेंगे।
चरण 1: GWT एप्लिकेशन बनाएं
GWT में बनाए गए GWT एप्लिकेशन को अपडेट करने के लिए निम्नलिखित चरणों का पालन करें - एप्लिकेशन अध्याय बनाएं -
| कदम | विवरण |
|---|---|
| 1 | GWT में बताए अनुसार एक पैकेज com.tutorialspoint के तहत एक नाम HelloWorld के साथ एक परियोजना बनाएं - एप्लिकेशन अध्याय बनाएं । |
| 2 | नीचे दिए गए अनुसार HelloWorld.gwt.xml , HelloWorld.html और HelloWorld.java को संशोधित करें। बाकी फाइलें अपरिवर्तित रखें। |
| 3 | लागू तर्क के परिणाम को सत्यापित करने के लिए एप्लिकेशन को संकलित करें और चलाएं। |
निम्नलिखित संशोधित मॉड्यूल विवरणक की सामग्री है src/com.tutorialspoint/HelloWorld.gwt.xml।
<?xml version = "1.0" encoding = "UTF-8"?>
<module rename-to = 'helloworld'>
   <inherits name = 'com.google.gwt.user.User'/>
   <inherits name = 'com.google.gwt.user.theme.clean.Clean'/>
   <entry-point class = 'com.tutorialspoint.client.HelloWorld'/>
   <inherits name="org.moxieapps.gwt.highcharts.Highcharts"/>
   <source path = 'client'/>
   <source path = 'shared'/>
</module>
निम्नलिखित संशोधित HTML होस्ट फ़ाइल की सामग्री है war/HelloWorld.html।
<html>
   <head>
      <title>GWT Highcharts Showcase</title>
      <link rel = "stylesheet" href = "HelloWorld.css"/>
      <script language = "javascript" src = "helloworld/helloworld.nocache.js">
         <script src = "https://ajax.googleapis.com/ajax/libs/jquery/2.1.3/jquery.min.js" />
         <script src = "https://code.highcharts.com/highcharts.js" />
      </script>
   </head>
   <body>
   </body>
</html>
हम विन्यास को समझने के बाद अंत में अपडेट किए गए HelloWorld.java देखेंगे।
चरण 2: विन्यास बनाएं
चार्ट बनाएं
चार्ट का प्रकार, शीर्षक और उप-शीर्षक कॉन्फ़िगर करें।
Chart chart = new Chart()
.setType(Type.SPLINE)
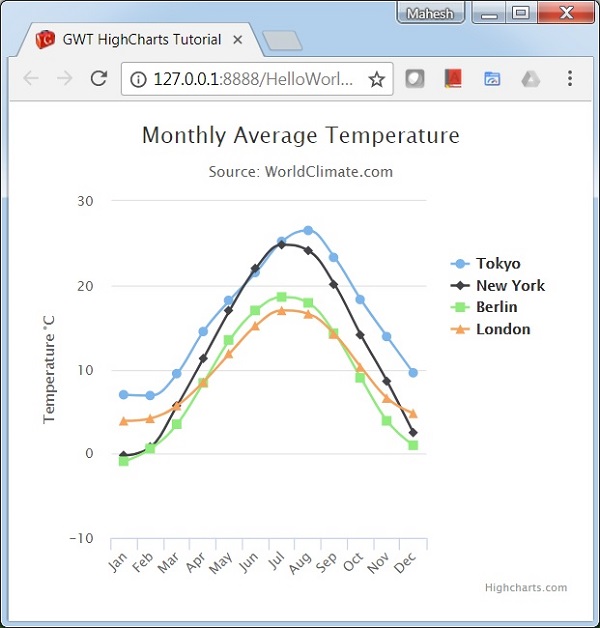
.setChartTitleText("Monthly Average Temperature")
.setChartSubtitleText("Source: WorldClimate.com");xAxis
एक्स-एक्सिस पर प्रदर्शित होने के लिए टिकर को कॉन्फ़िगर करें।
XAxis xAxis = chart.getXAxis();
xAxis.setCategories("Jan", "Feb", "Mar", "Apr", "May", "Jun",
   "Jul", "Aug", "Sep", "Oct", "Nov", "Dec");
yAxis
वाई-एक्सिस पर प्रदर्शित होने के लिए शीर्षक, प्लॉट लाइनों को कॉन्फ़िगर करें।
YAxis yAxis = chart.getYAxis();
yAxis.setAxisTitleText("Temperature °C");
yAxis.createPlotLine()
   .setValue(0)
   .setWidth(1)
   .setColor("#808080");
टूलटिप
टूलटिप को कॉन्फ़िगर करें। मूल्य (y- अक्ष) के बाद जोड़ा जाने वाला प्रत्यय लगाएं।
ToolTip toolTip = new ToolTip();
toolTip.setValueSuffix("°C");
chart.setToolTip(toolTip);
किंवदंती
अन्य गुणों के साथ चार्ट के दाईं ओर प्रदर्शित होने वाली किंवदंती को कॉन्फ़िगर करें।
legend.setLayout(Legend.Layout.VERTICAL)
   .setAlign(Legend.Align.RIGHT)
   .setVerticalAlign(Legend.VerticalAlign.TOP)
   .setX(-10)
   .setY(100)
   .setBorderWidth(0);
chart.setLegend(legend);
श्रृंखला
चार्ट पर प्रदर्शित होने वाले डेटा को कॉन्फ़िगर करें। श्रृंखला एक सरणी है जहां इस सरणी का प्रत्येक तत्व चार्ट पर एक पंक्ति का प्रतिनिधित्व करता है।
chart.addSeries(chart.createSeries()
   .setName("Tokyo")
   .setPoints(new Number[] {
      7.0, 6.9, 9.5, 14.5, 18.2, 21.5, 25.2,
      26.5, 23.3, 18.3, 13.9, 9.6
   })
);

chart.addSeries(chart.createSeries()
   .setName("New York")
   .setPoints(new Number[] {
      -0.2, 0.8, 5.7, 11.3, 17.0, 22.0, 24.8,
      24.1, 20.1, 14.1, 8.6, 2.5
   })
);

chart.addSeries(chart.createSeries()
   .setName("Berlin")
   .setPoints(new Number[] {
      -0.9, 0.6, 3.5, 8.4, 13.5, 17.0, 18.6,
      17.9, 14.3, 9.0, 3.9, 1.0
   })
);

chart.addSeries(chart.createSeries()
   .setName("London")
   .setPoints(new Number[] {
      3.9, 4.2, 5.7, 8.5, 11.9, 15.2, 17.0,
      16.6, 14.2, 10.3, 6.6, 4.8
   })
);
चरण 3: चार्ट को मूल पैनल में जोड़ें।
हम चार्ट को रूट पैनल में जोड़ रहे हैं।
RootPanel.get().add(chart);उदाहरण
कॉन्फ़िगरेशन सिंटैक्स को और समझने के लिए निम्नलिखित उदाहरण पर विचार करें -
HelloWorld.java
package com.tutorialspoint.client;

import org.moxieapps.gwt.highcharts.client.Chart;
import org.moxieapps.gwt.highcharts.client.Legend;
import org.moxieapps.gwt.highcharts.client.Series.Type;
import org.moxieapps.gwt.highcharts.client.ToolTip;
import org.moxieapps.gwt.highcharts.client.XAxis;
import org.moxieapps.gwt.highcharts.client.YAxis;

import com.google.gwt.core.client.EntryPoint;
import com.google.gwt.user.client.ui.RootPanel;

public class HelloWorld implements EntryPoint {
   public void onModuleLoad() {
      Chart chart = new Chart()
         .setType(Type.SPLINE)
         .setChartTitleText("Monthly Average Temperature")
         .setChartSubtitleText("Source: WorldClimate.com");

      XAxis xAxis = chart.getXAxis();
      xAxis.setCategories("Jan", "Feb", "Mar", "Apr", "May", "Jun",
         "Jul", "Aug", "Sep", "Oct", "Nov", "Dec");

      YAxis yAxis = chart.getYAxis();
      yAxis.setAxisTitleText("Temperature °C");
      yAxis.createPlotLine()
         .setValue(0)
         .setWidth(1)
         .setColor("#808080");

      ToolTip toolTip = new ToolTip();
      toolTip.setValueSuffix("°C");
      chart.setToolTip(toolTip);

      Legend legend = new Legend();
      legend.setLayout(Legend.Layout.VERTICAL)
         .setAlign(Legend.Align.RIGHT)
         .setVerticalAlign(Legend.VerticalAlign.TOP)
         .setX(-10)
         .setY(100)
         .setBorderWidth(0);
      chart.setLegend(legend);

      chart.addSeries(chart.createSeries()
         .setName("Tokyo")
         .setPoints(new Number[] {
            7.0, 6.9, 9.5, 14.5, 18.2, 21.5, 25.2,
            26.5, 23.3, 18.3, 13.9, 9.6
         })
      );

      chart.addSeries(chart.createSeries()
         .setName("New York")
         .setPoints(new Number[] {
            -0.2, 0.8, 5.7, 11.3, 17.0, 22.0, 24.8,
            24.1, 20.1, 14.1, 8.6, 2.5
         })
      );

      chart.addSeries(chart.createSeries()
         .setName("Berlin")
         .setPoints(new Number[] {
            -0.9, 0.6, 3.5, 8.4, 13.5, 17.0, 18.6,
            17.9, 14.3, 9.0, 3.9, 1.0
         })
      );

      chart.addSeries(chart.createSeries()
         .setName("London")
         .setPoints(new Number[] {
            3.9, 4.2, 5.7, 8.5, 11.9, 15.2, 17.0,
            16.6, 14.2, 10.3, 6.6, 4.8
         })
      );
      RootPanel.get().add(chart);
   }
}
परिणाम
परिणाम सत्यापित करें।