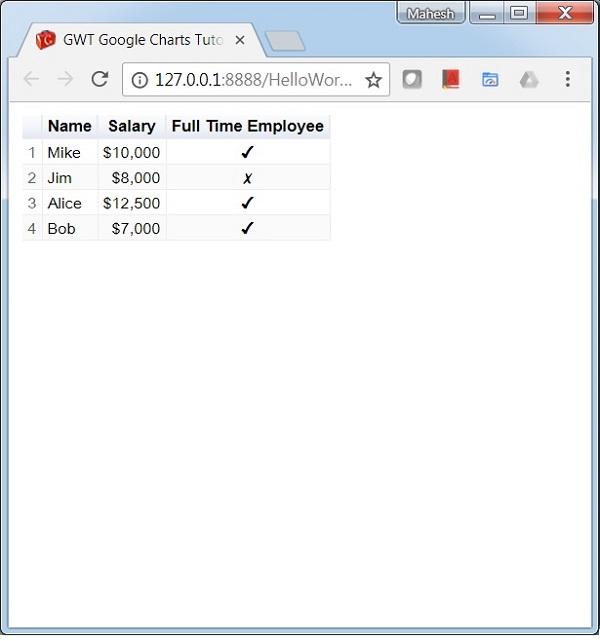
Diagram Google GWT - Diagram Tabel
Bagan tabel membantu dalam merender tabel yang dapat diurutkan dan diberi halaman. Sel tabel dapat diformat menggunakan string format, atau dengan langsung memasukkan HTML sebagai nilai sel. Nilai numerik diratakan ke kanan secara default; nilai boolean ditampilkan sebagai tanda centang atau tanda silang. Pengguna dapat memilih satu baris baik dengan keyboard atau mouse. Tajuk kolom dapat digunakan untuk menyortir. Baris tajuk tetap diperbaiki selama pengguliran. Tabel mengaktifkan peristiwa yang sesuai dengan interaksi pengguna.
Kita telah melihat konfigurasi yang digunakan untuk menggambar grafik di bab Sintaks Konfigurasi Google Charts . Sekarang, mari kita lihat contoh Bagan Tabel.
Konfigurasi
Kami telah menggunakan Table kelas untuk menunjukkan bagan Tabel.
Table chart = new Chart();Contoh
HelloWorld.java
package com.tutorialspoint.client;

import com.google.gwt.core.client.EntryPoint;
import com.google.gwt.user.client.ui.RootPanel;

import com.googlecode.gwt.charts.client.ChartLoader;
import com.googlecode.gwt.charts.client.ChartPackage;
import com.googlecode.gwt.charts.client.ColumnType;
import com.googlecode.gwt.charts.client.DataTable;
import com.googlecode.gwt.charts.client.table.Table;
import com.googlecode.gwt.charts.client.table.TableOptions;

public class HelloWorld implements EntryPoint {
   private Table chart;

   private void initialize() {
      ChartLoader chartLoader = new ChartLoader(ChartPackage.TABLE);
      chartLoader.loadApi(new Runnable() {
         public void run() {
            // Create and attach the chart
            chart = new Table();
            RootPanel.get().add(chart);
            draw();
         }
      });
   }
   private void draw() {
      // Prepare the data
      DataTable dataTable = DataTable.create();
      dataTable.addColumn(ColumnType.STRING, "Name");
      dataTable.addColumn(ColumnType.NUMBER, "Salary");
      dataTable.addColumn(ColumnType.BOOLEAN, "Full Time Employee");
      dataTable.addRows(4);

      dataTable.setCell(0, 0, "Mike");
      dataTable.setCell(0, 1, 10000, "$10,000");
      dataTable.setCell(0, 2, true);
      dataTable.setCell(1, 0, "Jim");
      dataTable.setCell(1, 1, 8000, "$8,000");
      dataTable.setCell(1, 2, false);
      dataTable.setCell(2, 0, "Alice");
      dataTable.setCell(2, 1, 12500, "$12,500");
      dataTable.setCell(2, 2, true);
      dataTable.setCell(3, 0, "Bob");
      dataTable.setCell(3, 1, 7000, "$7,000");
      dataTable.setCell(3, 2, true);

      TableOptions options  = TableOptions.create();
      options.setAlternatingRowStyle(true);
      options.setShowRowNumber(true);

      // Draw the chart
      chart.draw(dataTable, options);
      chart.setWidth("400px");
      chart.setHeight("400px");
   }
   public void onModuleLoad() {
      initialize();
   }
}
Hasil
Verifikasi hasilnya.
