CodeIgniter-ベンチマーク
ベンチマークポイントの設定
一連の行の実行にかかる時間またはメモリ使用量を測定する場合は、CodeIgniterのベンチマークポイントを使用して計算できます。別の「BenchmarkingCodeIgniterのこの目的のための」クラス。
このクラスは自動的にロードされます。ロードする必要はありません。これは、コントローラー、ビュー、およびモデルクラスのどこでも使用できます。あなたがしなければならないのは、開始点と終了点をマークしてから実行することですelapsed_time() これらの2つのマークされたポイント間で機能し、以下に示すように、そのコードの実行にかかった時間を取得できます。
<?php
   $this->benchmark->mark('code_start');

   // Some code happens here

   $this->benchmark->mark('code_end');

   echo $this->benchmark->elapsed_time('code_start', 'code_end');
?>
メモリ使用量を表示するには、関数を使用します memory_usage() 次のコードに示すように。
<?php
   echo $this->benchmark->memory_usage();
?>
例
と呼ばれるコントローラーを作成します Profiler_controller.php に保存します application/controller/Profiler_controller.php
<?php
   class Profiler_controller extends CI_Controller {

      public function index() {

         //enable profiler
         $this->output->enable_profiler(TRUE);
         $this->load->view('test');
      }

      public function disable() {

         //disable profiler
         $this->output->enable_profiler(FALSE);
         $this->load->view('test');
      }

   }
?>
と呼ばれるビューファイルを作成します test.php で保存します application/views/test.php
<!DOCTYPE html>
<html lang = "en">

   <head>
      <meta charset = "utf-8">
      <title>CodeIgniter View Example</title>
   </head>

   <body>
      CodeIgniter View Example
   </body>

</html>
でroutes.phpファイルを変更します application/config/routes.php 上記のコントローラーのルートを追加し、ファイルの最後に次の行を追加します。
$route['profiler'] = "Profiler_controller";
$route['profiler/disable'] = "Profiler_controller/disable"
その後、ブラウザのアドレスバーに次のURLを入力して、例を実行できます。
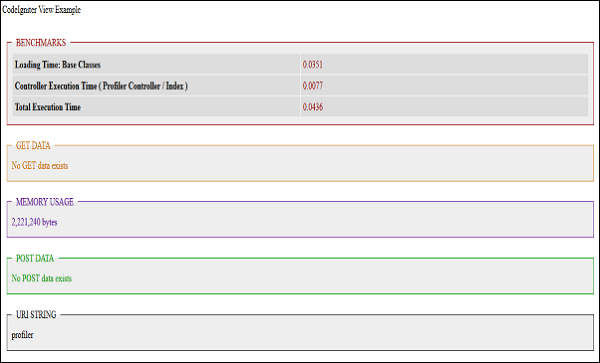
http://yoursite.com/index.php/profiler上記のURLはプロファイラーを有効にし、次のスクリーンショットに示すような出力を生成します。
プロファイリングを無効にするには、次のURLを実行します。
http://yoursite.com/index.php/profiler/disable