JFreeChart - Gráfico de bolhas
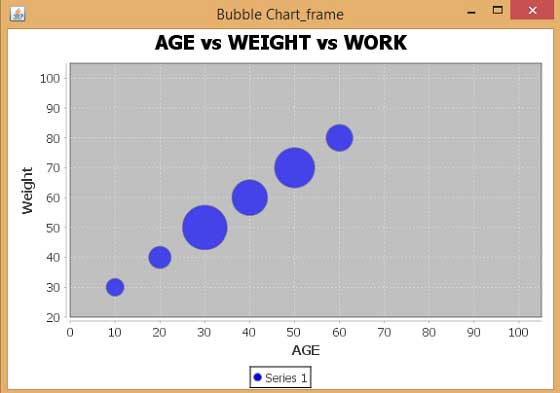
Este capítulo demonstra como você pode usar JFreeChart para criar Bubble Chartde um determinado conjunto de dados de negócios. Um gráfico de bolhas exibe informações de forma tridimensional. Uma bolha é plotada no local onde as coordenadas (x, y) se cruzam. O tamanho da bolha é considerado como intervalo ou quantidade dos eixos X e Y.
Dados de Negócios
Vamos considerar diferentes pessoas com sua idade, peso e capacidade de trabalho. A capacidade do wok pode ser tratada como o número de horas que é plotado como bolhas no gráfico.
| PESO | ||||||||
|---|---|---|---|---|---|---|---|---|
| AGE | 30 | 40 | 50 | 60 | 70 | 80 | ||
| 10 | 4 | WORK | ||||||
| 20 | 5 | |||||||
| 30 | 10 | |||||||
| 40 | 8 | |||||||
| 50 | 9 | |||||||
| 60 | 6 | |||||||
Aplicativo baseado em AWT
A seguir está o código para criar um gráfico de bolhas a partir das informações fornecidas acima. Este código ajuda você a incorporar um gráfico de bolhas em qualquer aplicativo baseado em AWT.
import java.awt.Color;
import java.awt.Dimension;

import javax.swing.JPanel;

import org.jfree.chart.*;
import org.jfree.chart.axis.NumberAxis;
import org.jfree.chart.plot.PlotOrientation;
import org.jfree.chart.plot.XYPlot;
import org.jfree.chart.renderer.xy.XYItemRenderer;
import org.jfree.data.xy.DefaultXYZDataset;
import org.jfree.data.xy.XYZDataset;
import org.jfree.ui.ApplicationFrame;
import org.jfree.ui.RefineryUtilities;

public class BubbleChart_AWT extends ApplicationFrame {

   public BubbleChart_AWT( String s ) {
      super( s );
      JPanel jpanel = createDemoPanel( );
      jpanel.setPreferredSize(new Dimension( 560 , 370 ) );
      setContentPane( jpanel );
   }

   private static JFreeChart createChart( XYZDataset xyzdataset ) {
      JFreeChart jfreechart = ChartFactory.createBubbleChart(
         "AGE vs WEIGHT vs WORK",
         "Weight",
         "AGE",
         xyzdataset,
         PlotOrientation.HORIZONTAL,
         true, true, false);

      XYPlot xyplot = ( XYPlot )jfreechart.getPlot( );
      xyplot.setForegroundAlpha( 0.65F );
      XYItemRenderer xyitemrenderer = xyplot.getRenderer( );
      xyitemrenderer.setSeriesPaint( 0 , Color.blue );
      NumberAxis numberaxis = ( NumberAxis )xyplot.getDomainAxis( );
      numberaxis.setLowerMargin( 0.2 );
      numberaxis.setUpperMargin( 0.5 );
      NumberAxis numberaxis1 = ( NumberAxis )xyplot.getRangeAxis( );
      numberaxis1.setLowerMargin( 0.8 );
      numberaxis1.setUpperMargin( 0.9 );

      return jfreechart;
   }

   public static XYZDataset createDataset( ) {
      DefaultXYZDataset defaultxyzdataset = new DefaultXYZDataset();
      double ad[ ] = { 30 , 40 , 50 , 60 , 70 , 80 };
      double ad1[ ] = { 10 , 20 , 30 , 40 , 50 , 60 };
      double ad2[ ] = { 4 , 5 , 10 , 8 , 9 , 6 };
      double ad3[][] = { ad , ad1 , ad2 };
      defaultxyzdataset.addSeries( "Series 1" , ad3 );

      return defaultxyzdataset;
   }

   public static JPanel createDemoPanel( ) {
      JFreeChart jfreechart = createChart( createDataset( ) );
      ChartPanel chartpanel = new ChartPanel( jfreechart );

      chartpanel.setDomainZoomable( true );
      chartpanel.setRangeZoomable( true );

      return chartpanel;
   }

   public static void main( String args[ ] ) {
      BubbleChart_AWT bubblechart = new BubbleChart_AWT( "Bubble Chart_frame" );
      bubblechart.pack( );
      RefineryUtilities.centerFrameOnScreen( bubblechart );
      bubblechart.setVisible( true );
   }
}
Vamos manter o código Java acima em BubbleChart_AWT.java arquivo e, em seguida, compilar e executá-lo a partir do comando solicitado como -
$javac BubbleChart_AWT.java
$java BubbleChart_AW
Se tudo estiver bem, ele será compilado e executado para gerar o seguinte Gráfico de Bolhas -

Criação de imagem JPEG
Vamos reescrever o exemplo acima para gerar uma imagem JPEG a partir de uma linha de comando.
import java.io.*;

import java.awt.Color;

import org.jfree.chart.*;
import org.jfree.chart.axis.NumberAxis;
import org.jfree.chart.plot.PlotOrientation;
import org.jfree.chart.plot.XYPlot;
import org.jfree.chart.renderer.xy.XYItemRenderer;
import org.jfree.data.xy.DefaultXYZDataset;
import org.jfree.chart.ChartUtilities;

public class BubbleChart_image {

   public static void main( String args[ ] )throws Exception {
      DefaultXYZDataset defaultxyzdataset = new DefaultXYZDataset( );
      double ad[ ] = { 30 , 40 , 50 , 60 , 70 , 80 };
      double ad1[ ] = { 10 , 20 , 30 , 40 , 50 , 60 };
      double ad2[ ] = { 4 , 5 , 10 , 8 , 9 , 6 };
      double ad3[ ][ ] = { ad , ad1 , ad2 };
      defaultxyzdataset.addSeries( "Series 1" , ad3 );

      JFreeChart jfreechart = ChartFactory.createBubbleChart(
         "AGE vs WEIGHT vs WORK",
         "Weight",
         "AGE",
         defaultxyzdataset,
         PlotOrientation.HORIZONTAL,
         true, true, false);

      XYPlot xyplot = ( XYPlot )jfreechart.getPlot( );
      xyplot.setForegroundAlpha( 0.65F );
      XYItemRenderer xyitemrenderer = xyplot.getRenderer( );
      xyitemrenderer.setSeriesPaint( 0 , Color.blue );
      NumberAxis numberaxis = ( NumberAxis )xyplot.getDomainAxis( );
      numberaxis.setLowerMargin( 0.2 );
      numberaxis.setUpperMargin( 0.5 );
      NumberAxis numberaxis1 = ( NumberAxis )xyplot.getRangeAxis( );
      numberaxis1.setLowerMargin( 0.8 );
      numberaxis1.setUpperMargin( 0.9 );

      int width = 560;   /* Width of the image */
      int height = 370;  /* Height of the image */
      File bubbleChart = new File("BubbleChart.jpeg");
      ChartUtilities.saveChartAsJPEG(bubbleChart,jfreechart,width,height);
   }
}
Vamos manter o código Java acima em BubbleChart_image.java arquivo e, em seguida, compilar e executá-lo a partir do comando solicitado como -
$javac BubbleChart_image.java
$java BubbleChart_image
Se tudo estiver bem, ele irá compilar e executar para criar um arquivo de imagem JPEG chamado BubbleChart.jpeg em seu diretório atual.