Highcharts เชิงมุม - ไวยากรณ์การกำหนดค่า
ในบทนี้เราจะแสดงการกำหนดค่าที่จำเป็นในการวาดแผนภูมิโดยใช้ Highcharts API ใน Angular
ขั้นตอนที่ 1 - สร้างแอปพลิเคชันเชิงมุม
ทำตามขั้นตอนต่อไปนี้เพื่ออัปเดตแอปพลิเคชัน Angular ที่เราสร้างในAngular 6 -บทการตั้งค่าโครงการ -
| ขั้นตอน | คำอธิบาย |
|---|---|
| 1 | สร้างโครงการที่มีชื่อhighchartsAppตามที่อธิบายไว้ในเชิงมุมที่ 6 - การติดตั้งโครงการบท |
| 2 | แก้ไขapp.module.ts , app.component.tsและapp.component.htmlตามที่อธิบายด้านล่าง เก็บไฟล์ที่เหลือไว้ไม่เปลี่ยนแปลง |
| 3 | คอมไพล์และเรียกใช้แอปพลิเคชันเพื่อตรวจสอบผลลัพธ์ของตรรกะที่ใช้งาน |
ต่อไปนี้เป็นเนื้อหาของตัวอธิบายโมดูลที่แก้ไข app.module.ts.
import { BrowserModule } from '@angular/platform-browser';
import { NgModule } from '@angular/core';
import { AppComponent } from './app.component';
import { HighchartsChartComponent } from 'highcharts-angular';
@NgModule({
   declarations: [
      AppComponent,
      HighchartsChartComponent
   ],
   imports: [
      BrowserModule,
   ],
   providers: [],
   bootstrap: [AppComponent]
})
export class AppModule { }
ต่อไปนี้เป็นเนื้อหาของไฟล์โฮสต์ HTML ที่แก้ไข app.component.html.
<highcharts-chart
   [Highcharts] = "highcharts"
   [options] = "chartOptions"
   style = "width: 100%; height: 400px; display: block;">
</highcharts-chart>
เราจะเห็น app.component.ts ที่อัปเดตในตอนท้ายหลังจากทำความเข้าใจกับการกำหนดค่าแล้ว
ขั้นตอนที่ 2 - ใช้การกำหนดค่า
สร้าง Highcharts และสร้าง chartOptions
highcharts = Highcharts;
   chartOptions = {
}
สร้างแผนภูมิ
กำหนดค่าประเภทหัวเรื่องและหัวเรื่องย่อยของแผนภูมิโดยใช้ chartOptions
chart: {
   type: "spline"
},
xAxis
กำหนดค่าทิกเกอร์ที่จะแสดงบนแกน X โดยใช้ chartOptions
xAxis:{
   categories:["Jan", "Feb", "Mar", "Apr", "May", "Jun", "Jul", "Aug", "Sep", "Oct", "Nov", "Dec"]
},
yAxis
กำหนดค่าหัวเรื่องที่จะแสดงบนแกน Y โดยใช้ chartOptions
yAxis: {
   title:{
      text:"Temperature °C"
   }
},
คำแนะนำเครื่องมือ
กำหนดค่าคำแนะนำเครื่องมือ ใส่คำต่อท้ายที่จะเพิ่มหลังค่า (แกน y) โดยใช้ chartOptions
tooltip: {
   valueSuffix:" °C"
},
ชุด
กำหนดค่าข้อมูลที่จะแสดงบนแผนภูมิโดยใช้ chartOptions Series คืออาร์เรย์ที่แต่ละองค์ประกอบของอาร์เรย์นี้แสดงถึงบรรทัดเดียวบนแผนภูมิ
series: [
   {
      name: 'Tokyo',
      data: [7.0, 6.9, 9.5, 14.5, 18.2, 21.5, 25.2,26.5, 23.3, 18.3, 13.9, 9.6]
   },
   {
      name: 'New York',
      data: [-0.2, 0.8, 5.7, 11.3, 17.0, 22.0, 24.8,24.1, 20.1, 14.1, 8.6, 2.5]
   },
   {
      name: 'Berlin',
      data: [-0.9, 0.6, 3.5, 8.4, 13.5, 17.0, 18.6, 17.9, 14.3, 9.0, 3.9, 1.0]
   },
   {
      name: 'London',
      data: [3.9, 4.2, 5.7, 8.5, 11.9, 15.2, 17.0, 16.6, 14.2, 10.3, 6.6, 4.8]
   }
]
ตัวอย่าง
พิจารณาตัวอย่างต่อไปนี้เพื่อทำความเข้าใจไวยากรณ์การกำหนดค่าเพิ่มเติม -
app.component.ts
import { Component } from '@angular/core';
import * as Highcharts from 'highcharts';
@Component({
   selector: 'app-root',
   templateUrl: './app.component.html',
   styleUrls: ['./app.component.css']
})
export class AppComponent {
   highcharts = Highcharts;
   chartOptions = {
      chart: {
         type: "spline"
      },
      title: {
         text: "Monthly Average Temperature"
      },
      subtitle: {
         text: "Source: WorldClimate.com"
      },
      xAxis:{
         categories:["Jan", "Feb", "Mar", "Apr", "May", "Jun",
            "Jul", "Aug", "Sep", "Oct", "Nov", "Dec"]
      },
      yAxis: {
         title:{
            text:"Temperature °C"
         }
      },
      tooltip: {
         valueSuffix:" °C"
      },
      series: [
         {
            name: 'Tokyo',
            data: [7.0, 6.9, 9.5, 14.5, 18.2, 21.5, 25.2,26.5, 23.3, 18.3, 13.9, 9.6]
         },
         {
            name: 'New York',
            data: [-0.2, 0.8, 5.7, 11.3, 17.0, 22.0, 24.8,24.1, 20.1, 14.1, 8.6, 2.5]
         },
         {
            name: 'Berlin',
            data: [-0.9, 0.6, 3.5, 8.4, 13.5, 17.0, 18.6, 17.9, 14.3, 9.0, 3.9, 1.0]
         },
         {
            name: 'London',
            data: [3.9, 4.2, 5.7, 8.5, 11.9, 15.2, 17.0, 16.6, 14.2, 10.3, 6.6, 4.8]
         }
      ]
   };
}
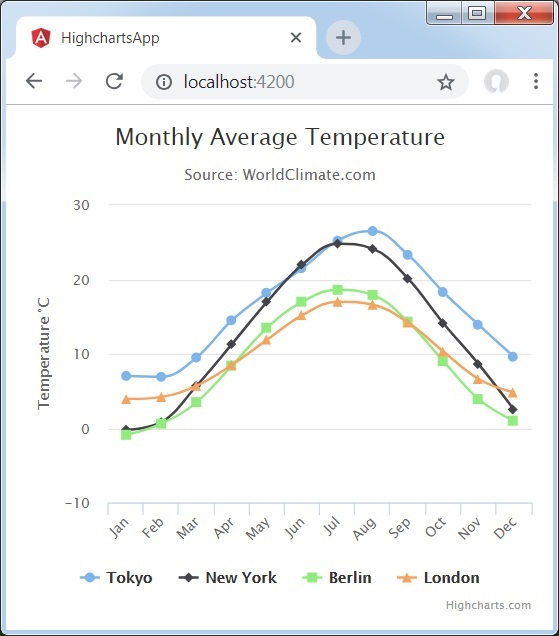
ผลลัพธ์
ตรวจสอบผลลัพธ์
