Angular Google Charts-조직도
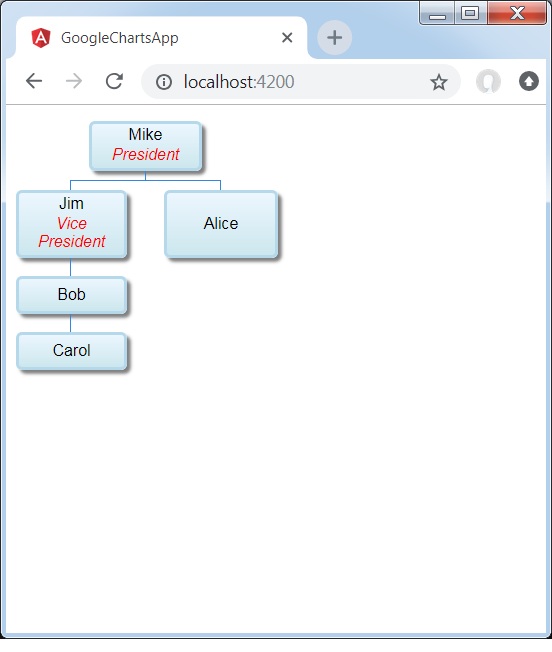
다음은 조직도의 예입니다.
조직도는 조직에서 상위 / 하위 관계를 나타내는 데 사용되는 노드 계층 구조를 렌더링하는 데 도움이됩니다. 예를 들어, 가계도는 조직도의 한 유형입니다. Google 차트 구성 구문 장 에서 차트를 그리는 데 사용 된 구성을 이미 살펴 보았습니다 . 이제 조직도의 예를 살펴 보겠습니다.
구성
우리는 사용했습니다 OrgChart 클래스는 조직도를 표시합니다.
type='OrgChart';예
app.component.ts
import { Component } from '@angular/core';
@Component({
   selector: 'app-root',
   templateUrl: './app.component.html',
   styleUrls: ['./app.component.css']
})
export class AppComponent {
   title = '';
   type = 'OrgChart';
   data = [
      [{v:'Mike', f:'Mike<div style="color:red; font-style:italic">President</div>'},
         '', 'The President'],
      [{v:'Jim', f:'Jim<div style="color:red; font-style:italic">Vice President</div>'},
         'Mike', 'VP'],
      ['Alice', 'Mike', ''],
      ['Bob', 'Jim', 'Bob Sponge'],
      ['Carol', 'Bob', '']
   ];
   columnNames = ["Name","Manager","Tooltip"];
   options = {
      allowHtml: true
   };
   width = 550;
   height = 400;
}
결과
결과를 확인하십시오.
