Kibana - การทำงานกับแผนที่ภูมิภาค
ด้วยการแสดงภาพนี้คุณจะเห็นข้อมูลที่แสดงบนแผนที่โลกทางภูมิศาสตร์ ในบทนี้ให้เราดูโดยละเอียด
สร้างดัชนีสำหรับแผนที่ภูมิภาค
เราจะสร้างดัชนีใหม่เพื่อทำงานกับการแสดงภาพแผนที่ภูมิภาค ข้อมูลที่เราจะอัปโหลดแสดงที่นี่ -
{"index":{"_id":1}}
{"country": "China", "population": "1313973713"}
{"index":{"_id":2}}
{"country": "India", "population": "1095351995"}
{"index":{"_id":3}}
{"country": "United States", "population": "298444215"}
{"index":{"_id":4}}
{"country": "Indonesia", "population": "245452739"}
{"index":{"_id":5}}
{"country": "Brazil", "population": "188078227"}
{"index":{"_id":6}}
{"country": "Pakistan", "population": "165803560"}
{"index":{"_id":7}}
{"country": "Bangladesh", "population": "147365352"}
{"index":{"_id":8}}
{"country": "Russia", "population": "142893540"}
{"index":{"_id":9}}
{"country": "Nigeria", "population": "131859731"}
{"index":{"_id":10}}
{"country": "Japan", "population": "127463611"}
โปรดทราบว่าเราจะใช้ _bulk upload ในเครื่องมือ dev เพื่ออัปโหลดข้อมูล
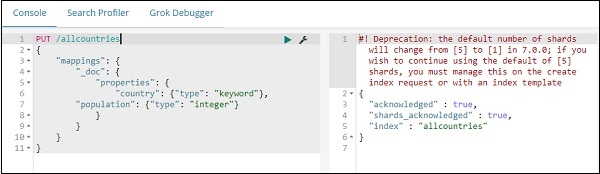
ตอนนี้ไปที่ Kibana Dev Tools และดำเนินการค้นหาต่อไปนี้ -
PUT /allcountries
{
"mappings": {
"_doc": {
"properties": {
"country": {"type": "keyword"},
"population": {"type": "integer"}
}
}
}
}
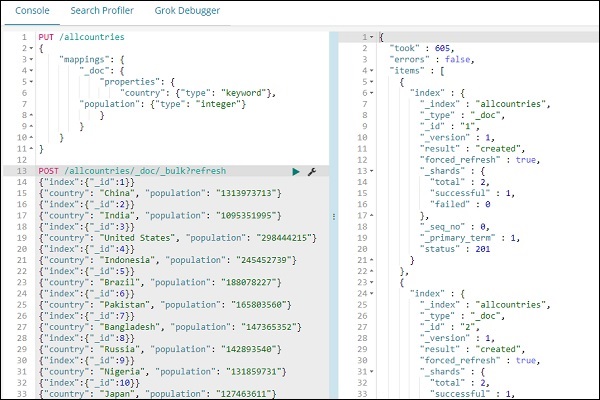
POST /allcountries/_doc/_bulk?refresh
{"index":{"_id":1}}
{"country": "China", "population": "1313973713"}
{"index":{"_id":2}}
{"country": "India", "population": "1095351995"}
{"index":{"_id":3}}
{"country": "United States", "population": "298444215"}
{"index":{"_id":4}}
{"country": "Indonesia", "population": "245452739"}
{"index":{"_id":5}}
{"country": "Brazil", "population": "188078227"}
{"index":{"_id":6}}
{"country": "Pakistan", "population": "165803560"}
{"index":{"_id":7}}
{"country": "Bangladesh", "population": "147365352"}
{"index":{"_id":8}}
{"country": "Russia", "population": "142893540"}
{"index":{"_id":9}}
{"country": "Nigeria", "population": "131859731"}
{"index":{"_id":10}}
{"country": "Japan", "population": "127463611"}ต่อไปให้เราสร้างดัชนีทุกประเทศ เราได้ระบุประเภทฟิลด์ประเทศเป็นkeyword -
PUT /allcountries
{
   "mappings": {
      "_doc": {
         "properties": {
            "country": {"type": "keyword"},
            "population": {"type": "integer"}
         }
      }
   }
}
Note - ในการทำงานกับแผนที่ภูมิภาคเราจำเป็นต้องระบุประเภทฟิลด์ที่จะใช้กับการรวมเป็นประเภทเป็นคำสำคัญ
เมื่อเสร็จแล้วให้อัปโหลดข้อมูลโดยใช้คำสั่ง _bulk
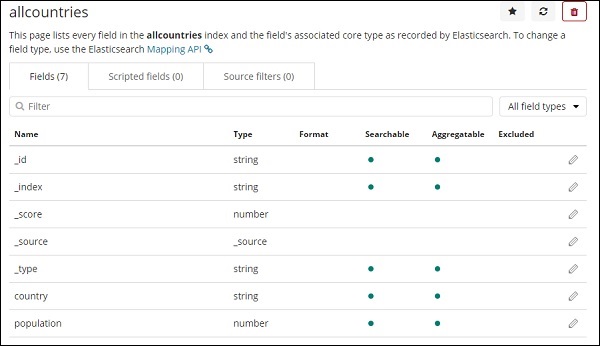
ตอนนี้เราจะสร้างรูปแบบดัชนี ไปที่แท็บ Kibana Management และเลือกสร้างรูปแบบดัชนี

นี่คือฟิลด์ที่แสดงจากดัชนีทุกประเทศ
เริ่มต้นใช้งานแผนที่ภูมิภาค
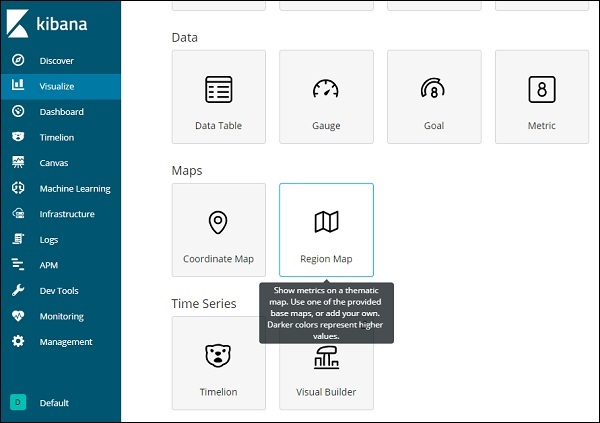
ตอนนี้เราจะสร้างภาพโดยใช้แผนที่ภูมิภาค ไปที่การแสดงภาพและเลือกแผนที่ภูมิภาค
เมื่อเสร็จแล้วให้เลือกดัชนีเป็นทุกประเทศและดำเนินการต่อ
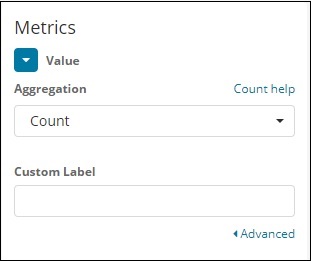
เลือก Aggregation Metrics และ Bucket Metrics ดังที่แสดงด้านล่าง -
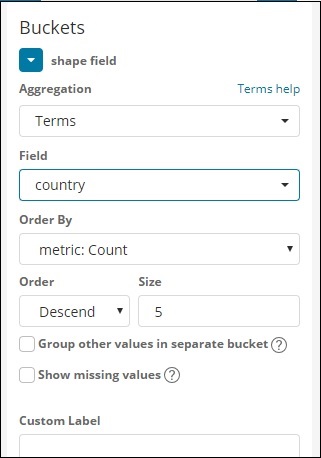
ที่นี่เราได้เลือกฟิลด์เป็นประเทศตามที่ฉันต้องการแสดงเช่นเดียวกันบนแผนที่โลก
แผนที่เวกเตอร์และเขตข้อมูลเข้าร่วมสำหรับแผนที่ภูมิภาค
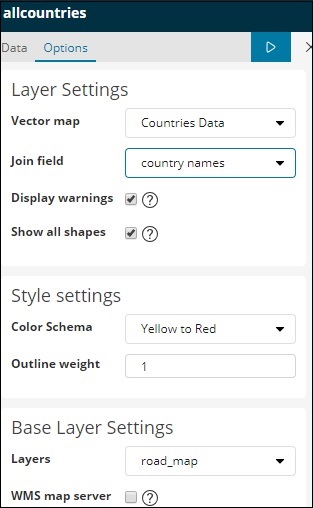
สำหรับแผนที่ภูมิภาคเราจำเป็นต้องเลือกแท็บตัวเลือกดังที่แสดงด้านล่าง -

แท็บตัวเลือกมีการกำหนดค่า Layer Settings ซึ่งจำเป็นสำหรับการลงจุดข้อมูลบนแผนที่โลก
แผนที่เวกเตอร์มีตัวเลือกดังต่อไปนี้ -
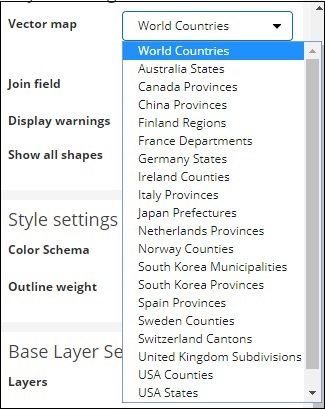
ที่นี่เราจะเลือกประเทศทั่วโลกเนื่องจากฉันมีข้อมูลประเทศ
ช่องเข้าร่วมมีรายละเอียดดังต่อไปนี้ -
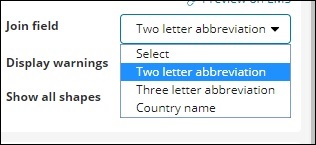
ในดัชนีของเราเรามีชื่อประเทศดังนั้นเราจะเลือกชื่อประเทศ
ในการตั้งค่ารูปแบบคุณสามารถเลือกสีที่จะแสดงสำหรับประเทศต่างๆได้ -
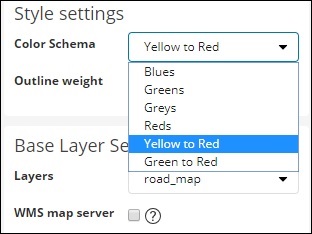
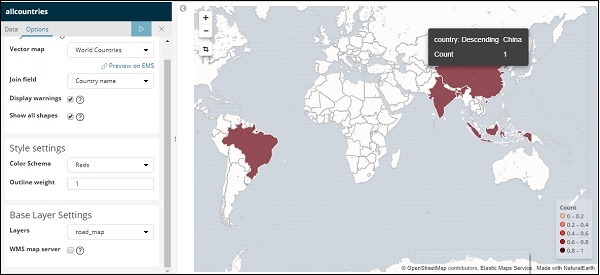
เราจะเลือกสีแดง เราจะไม่แตะต้องส่วนที่เหลือของรายละเอียด
ตอนนี้คลิกที่ปุ่มวิเคราะห์เพื่อดูรายละเอียดของประเทศที่วางแผนไว้บนแผนที่โลกดังที่แสดงด้านล่าง -
แผนที่เวกเตอร์ที่โฮสต์เองและเข้าร่วมฟิลด์ใน Kibana
คุณยังสามารถเพิ่มการตั้งค่า Kibana ของคุณเองสำหรับแผนที่เวกเตอร์และฟิลด์เข้าร่วม โดยไปที่ kibana.yml จากโฟลเดอร์ kibana config และเพิ่มรายละเอียดต่อไปนี้ -
regionmap:
   includeElasticMapsService: false
   layers:
      - name: "Countries Data"
      url: "http://localhost/kibana/worldcountries.geojson"
      attribution: "INRAP"
      fields:
         - name: "Country"
         description: "country names"
แผนที่เวกเตอร์จากแท็บตัวเลือกจะมีการเติมข้อมูลข้างต้นแทนค่าเริ่มต้น โปรดทราบว่า URL ที่ระบุจะต้องเปิดใช้งาน CORS เพื่อให้ Kibana สามารถดาวน์โหลดได้ ไฟล์ json ที่ใช้ควรอยู่ในลักษณะที่พิกัดอยู่ในความต่อเนื่อง ตัวอย่างเช่น -
https://vector.maps.elastic.co/blob/5659313586569216?elastic_tile_service_tos=agreeแท็บตัวเลือกเมื่อรายละเอียดแผนที่เวกเตอร์แผนที่ภูมิภาคเป็นโฮสต์ในตัวเองแสดงอยู่ด้านล่าง -