고급 Excel-통합 문서 분석
Workbook Analysis 명령은 통합 문서와 해당 구조, 수식, 셀, 범위 및 경고에 대한 자세한 정보를 보여주는 대화 형 보고서를 만듭니다.
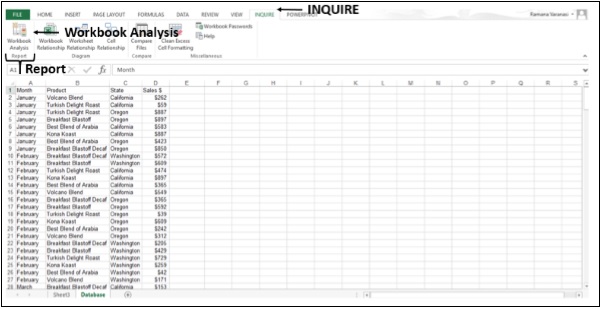
Step 1 − 리본에서 조회 탭을 클릭합니다.
Step 2 − 클릭 Workbook 보고서 그룹의 분석.
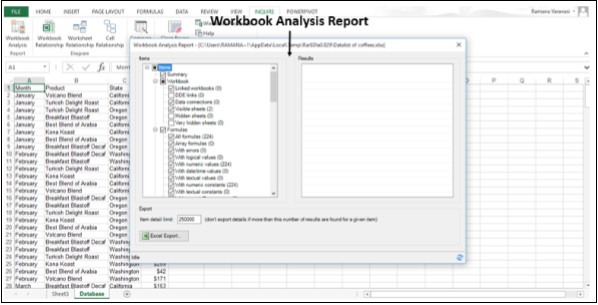
그만큼 Report 표시됩니다 Workbook Analysis 완성 됐습니다.
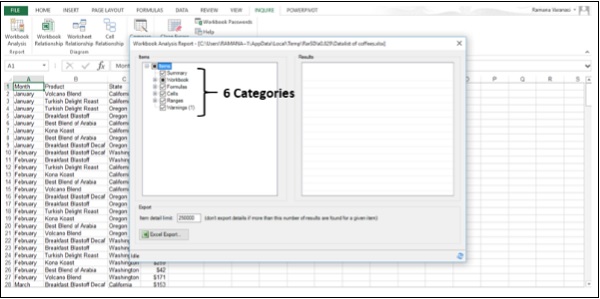
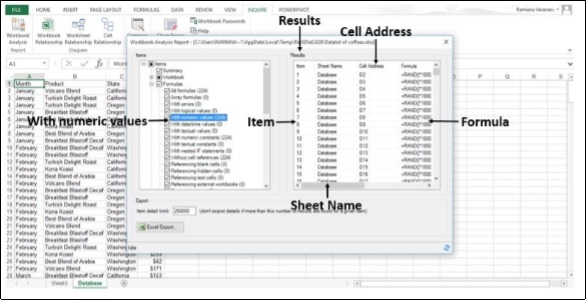
보고서에는 여섯 가지 범주가 있습니다-
Summary − 워크 북의 구조 및 내용에 대한 일반 정보.
Workbook (with subcategories) − 일반 통합 문서 통계.
Formulas (with subcategories) − 워크 북의 공식에 대한 특정 정보.
Cells (with subcategories) − 통합 문서의 셀에 대한 특정 정보.
Ranges (with subcategories) − 워크 북의 범위에 대한 특정 정보.
Warnings − 워크 북 구조 및 내용에 대한 여러 유형의 경고.
선택 Category 해당 카테고리에 대한 자세한 정보를 제공합니다.
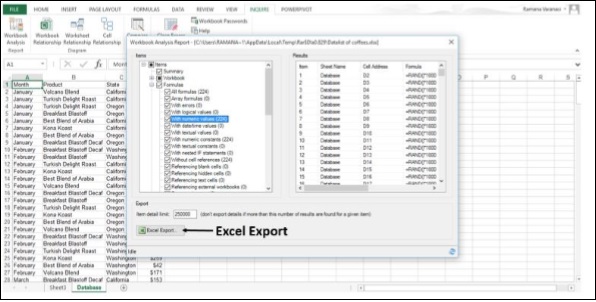
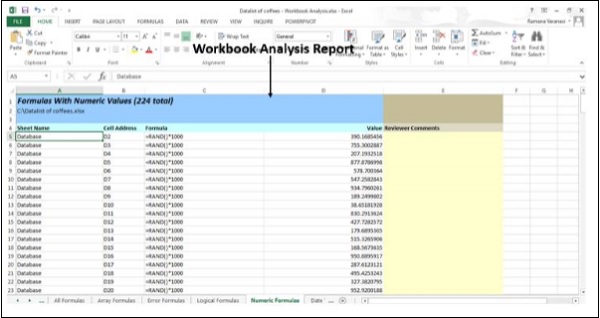
Step 3− 공식 카테고리를 클릭합니다. 수식의 하위 범주가 표시됩니다.
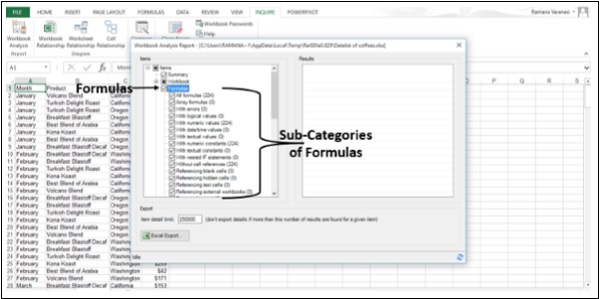
예를 들면
- 모든 공식은 224 개입니다.
- 숫자 값은 숫자로 224입니다.
Step 4− 하위 카테고리를 클릭합니다. 예를 들어 "숫자 값 포함"을 클릭합니다.
Step 5 − Excel 내보내기 버튼을 클릭합니다.
다른 이름으로 저장 대화 상자가 열립니다.
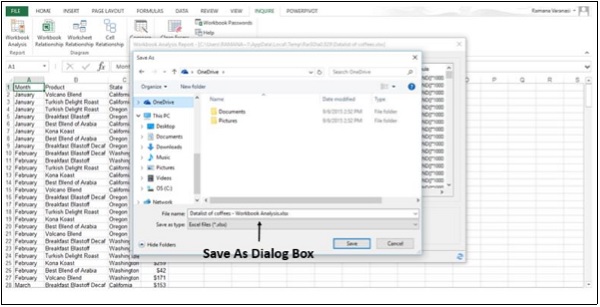
Step 6 − 저장 ReportExcel 통합 문서로. ㅏLoad Export File 버튼이 옆에 나타납니다. Excel Export 단추.
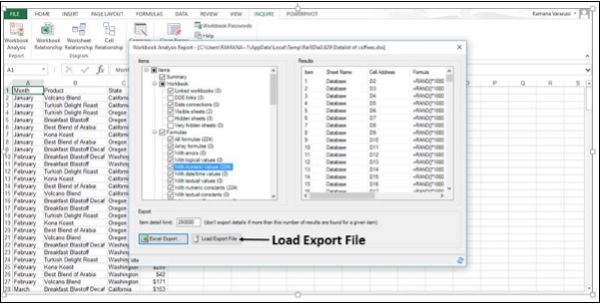
Step 7 − 클릭 Load Export File단추. 저장된 보고서 Excel 통합 문서가 열립니다.
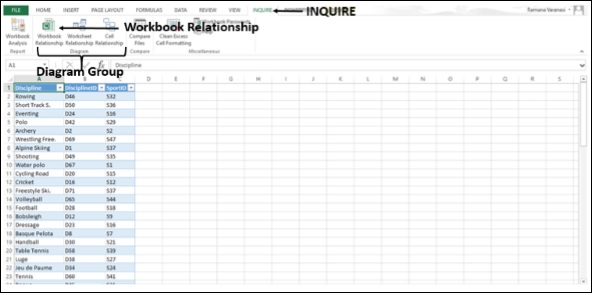
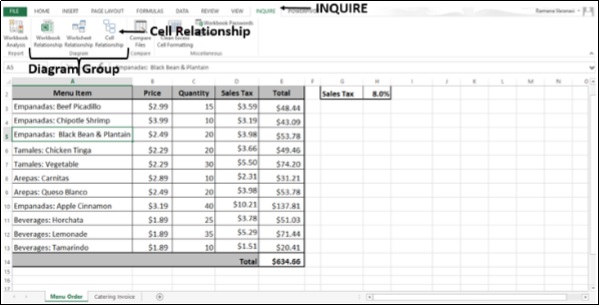
다이어그램
에서 Diagram 그룹, 아래 INQUIRE 탭에서 세 가지 유형의 다이어그램을 사용할 수 있습니다.
- 통합 문서 관계
- 워크 시트 관계
- 세포 관계
링크로 만든 대화 형 다이어그램입니다. 링크는 다이어그램의 노드 간의 종속성을 보여줍니다. 링크 또는 노드를 끌어서 정렬하고 원하는 항목을 볼 수 있도록 정렬 할 수 있습니다.
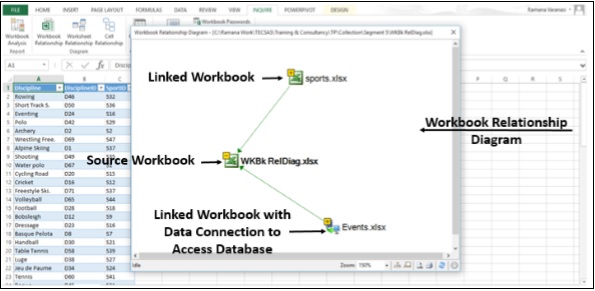
통합 문서 관계
당신은 사용할 수 있습니다 Workbook Relationship 파일 간의 연결 (링크)에 의해 생성 된 통합 문서 종속성의 대화 형 그래픽 맵을 만드는 다이어그램.
다이어그램의 링크 유형에는 다른 통합 문서, Access 데이터베이스, 텍스트 파일, HTML 페이지, SQL Server 데이터베이스 및 기타 데이터 원본이 포함될 수 있습니다.
Step 1 − 클릭 INQUIRE 리본의 탭.
Step 2 − 클릭 Workbook Relationship 다이어그램 그룹에서.
다른 데이터 소스와의 링크를 보여주는 통합 문서 관계 다이어그램이 나타납니다.
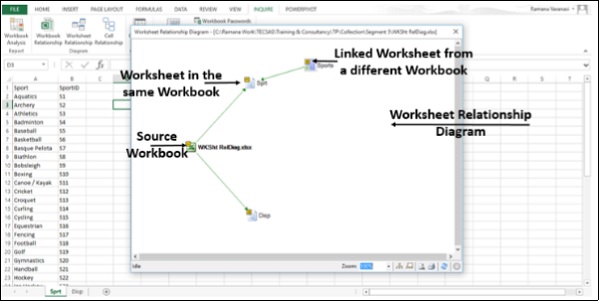
워크 시트 관계
당신이 사용할 수있는 Worksheet Relationship 동일한 통합 문서의 워크 시트 및 / 또는 다른 통합 문서의 워크 시트 간 연결 (링크)의 대화 형 그래픽 맵을 만드는 다이어그램.
Step 1 − 클릭 INQUIRE 리본의 탭.
Step 2 − 클릭 Worksheet Relationship 다이어그램 그룹에서.
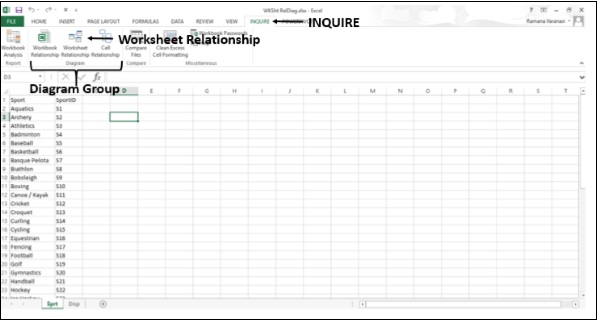
그만큼 Worksheet Relationship 동일한 통합 문서와 다른 통합 문서에있는 워크 시트 간의 링크를 보여주는 다이어그램이 나타납니다.
세포 관계
당신은 사용할 수 있습니다 Cell Relationship 선택한 셀에서 다른 워크 시트 또는 다른 통합 문서의 셀로 연결되는 모든 링크에 대한 자세한 대화 형 다이어그램을 가져 오는 다이어그램.
Step 1 − 클릭 INQUIRE 리본의 탭.
Step 2 − 클릭 Cell Relationship 에 Diagram 그룹.
그만큼 Cell Relationship Diagram 옵션 창이 나타납니다.
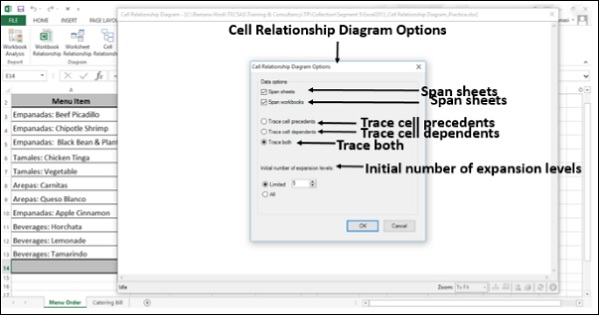
Step 3 − 옵션을 선택합니다.
Step 4 − 클릭 OK.
그만큼 Cell Relationship Diagram 선택한 옵션에 따라 동일한 워크 시트, 동일한 워크 북 및 다른 워크 북에있는 셀과 선택한 셀 간의 링크가 표시됩니다.
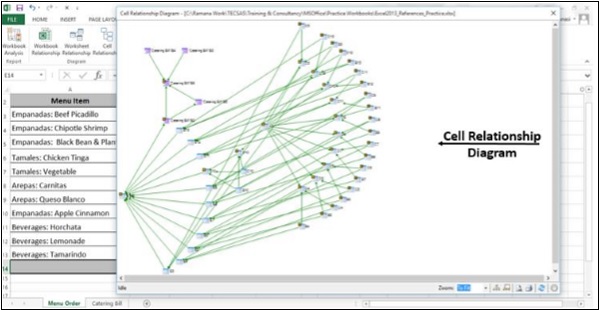
Step 5 − 클릭 Zoom.
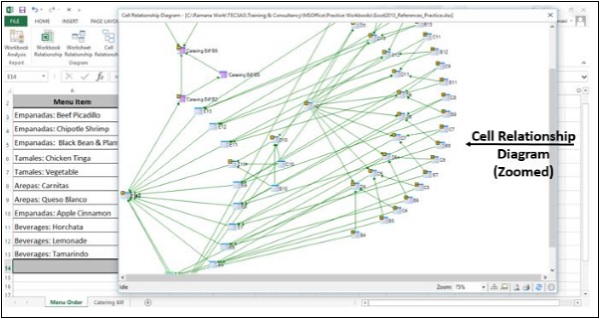
노드를 명확하게 볼 수 있습니다.
초과 셀 서식 정리
통합 문서가 느리게로드되거나 크기가 커지면 모르는 행이나 열에 서식이 적용될 수 있습니다.
당신은 사용할 수 있습니다 Clean Excess Cell Formatting명령을 사용하여 초과 서식을 제거하고 파일 크기를 크게 줄입니다. 이렇게하면 파일 크기가 줄어들고 Excel의 속도가 향상됩니다.
그러나이 프로세스로 인해 파일 크기가 증가 할 수 있고 변경 사항을 취소 할 방법이 없기 때문에 과도한 셀 서식을 정리하기 전에 파일의 백업 복사본을 만들 수 있습니다.
Step 1 − 클릭 INQUIRE 리본의 탭.
Step 2 − 클릭 Clean Excess Cell Formatting 에 Miscellaneous 그룹.
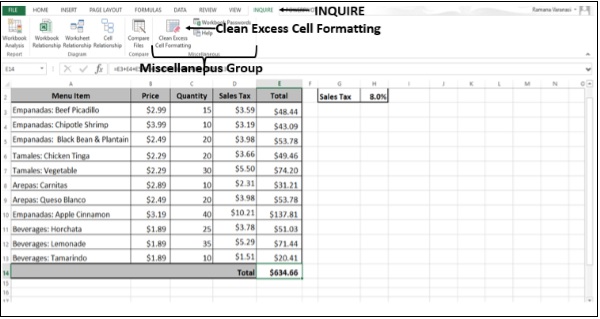
그만큼 Clean Excess Cell Formatting 대화 상자가 나타납니다.
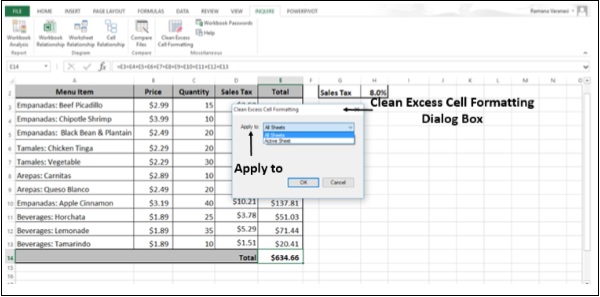
Step 3 − 선택 All Sheets 에 Apply to상자. 변경 사항 저장에 대한 메시지가 표시됩니다.

Step 4 − 클릭 OK.