Bokeh-레이아웃
Bokeh 시각화는 다양한 레이아웃 옵션으로 적절하게 배열 할 수 있습니다. 이러한 레이아웃과 크기 조정 모드는 브라우저 창의 크기에 따라 플롯과 위젯의 크기를 자동으로 조정합니다. 일관된 모양을 위해 레이아웃의 모든 항목은 동일한 크기 조정 모드를 가져야합니다. 위젯 (버튼, 메뉴 등)은 플롯 그림이 아닌 별도의 위젯 상자에 보관됩니다.
첫 번째 레이아웃 유형은 플롯 그림을 세로로 표시하는 열 레이아웃입니다. 그만큼column() function 정의됩니다 bokeh.layouts 모듈과 다음 서명을 취합니다-
from bokeh.layouts import column
col = column(children, sizing_mode)
children − 플롯 및 / 또는 위젯 목록.
sizing_mode− 레이아웃의 항목 크기를 결정합니다. 가능한 값은 "fixed", "stretch_both", "scale_width", "scale_height", "scale_both"입니다. 기본값은 "고정"입니다.
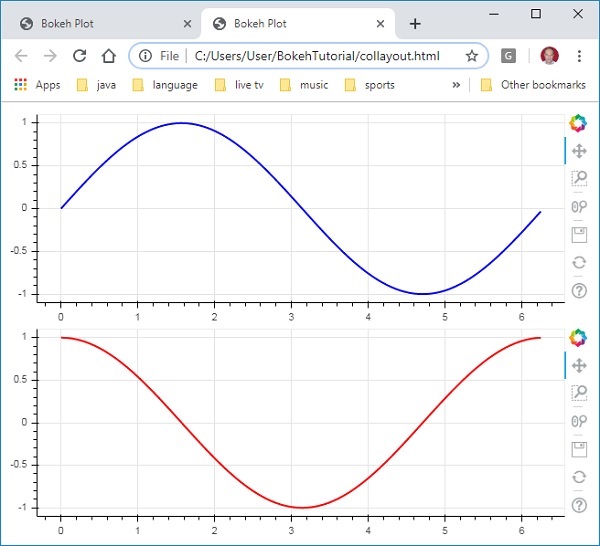
다음 코드는 두 개의 Bokeh 도형을 생성하고 세로로 표시되도록 열 레이아웃에 배치합니다. x 및 y 데이터 계열 간의 사인 및 cos 관계를 나타내는 선 글리프가 각 그림에 표시됩니다.
from bokeh.plotting import figure, output_file, show
from bokeh.layouts import column
import numpy as np
import math
x = np.arange(0, math.pi*2, 0.05)
y1 = np.sin(x)
y2 = np.cos(x)
fig1 = figure(plot_width = 200, plot_height = 200)
fig1.line(x, y1,line_width = 2, line_color = 'blue')
fig2 = figure(plot_width = 200, plot_height = 200)
fig2.line(x, y2,line_width = 2, line_color = 'red')
c = column(children = [fig1, fig2], sizing_mode = 'stretch_both')
show(c)
산출

마찬가지로 행 레이아웃은 플롯을 수평으로 정렬합니다. row() functionbokeh.layouts 모듈에 정의 된대로 사용됩니다. 당신이 생각하는 것처럼, 그것은 또한 두 가지 주장을 취합니다.column() function) – children 및 sizing_mode.
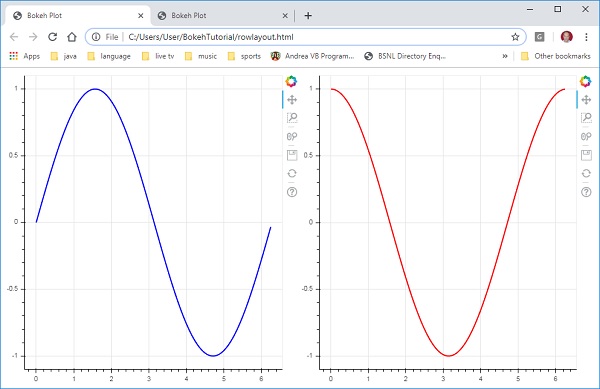
위 다이어그램에서 세로로 표시된 사인 및 cos 곡선은 이제 다음 코드와 함께 행 레이아웃에서 가로로 표시됩니다.
from bokeh.plotting import figure, output_file, show
from bokeh.layouts import row
import numpy as np
import math
x = np.arange(0, math.pi*2, 0.05)
y1 = np.sin(x)
y2 = np.cos(x)
fig1 = figure(plot_width = 200, plot_height = 200)
fig1.line(x, y1,line_width = 2, line_color = 'blue')
fig2 = figure(plot_width = 200, plot_height = 200)
fig2.line(x, y2,line_width = 2, line_color = 'red')
r = row(children = [fig1, fig2], sizing_mode = 'stretch_both')
show(r)
산출

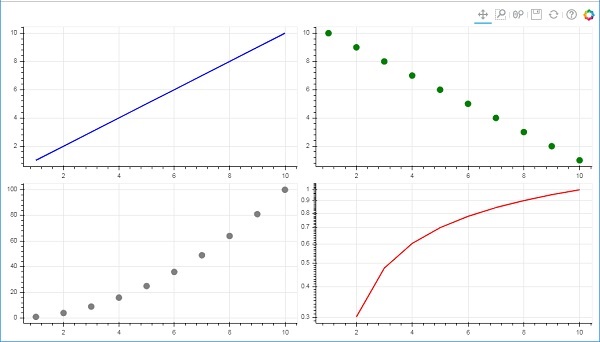
Bokeh 패키지에는 그리드 레이아웃도 있습니다. 행과 열의 2 차원 그리드에 여러 플롯 그림 (위젯 포함)을 보유합니다. 그만큼gridplot() function bokeh.layouts 모듈에서는 toolbar_location 속성의 도움으로 배치 할 수있는 그리드와 단일 통합 툴바를 반환합니다.
이것은 각 플롯이 자체 도구 모음을 표시하는 행 또는 열 레이아웃과 다릅니다. grid () 함수도 children 및 sizing_mode 매개 변수를 사용합니다. 여기서 children은 목록 목록입니다. 각 하위 목록이 동일한 차원인지 확인하십시오.
다음 코드에서는 x 및 y 데이터 계열 간의 네 가지 다른 관계가 2 개의 행과 2 개의 열로 구성된 그리드에 표시됩니다.
from bokeh.plotting import figure, output_file, show
from bokeh.layouts import gridplot
import math
x = list(range(1,11))

y1 = x
y2 =[11-i for i in x]
y3 = [i*i for i in x]
y4 = [math.log10(i) for i in x]

fig1 = figure(plot_width = 200, plot_height = 200)
fig1.line(x, y1,line_width = 2, line_color = 'blue')
fig2 = figure(plot_width = 200, plot_height = 200)
fig2.circle(x, y2,size = 10, color = 'green')
fig3 = figure(plot_width = 200, plot_height = 200)
fig3.circle(x,y3, size = 10, color = 'grey')
fig4 = figure(plot_width = 200, plot_height = 200, y_axis_type = 'log')
fig4.line(x,y4, line_width = 2, line_color = 'red')
grid = gridplot(children = [[fig1, fig2], [fig3,fig4]], sizing_mode = 'stretch_both')
show(grid)
산출
