Kibana-座標マップの操作
Kibanaの座標マップは、地理的領域を表示し、指定した集計に基づいてその領域を円でマークします。
座標マップのインデックスを作成する
座標マップに使用されるバケット集計は、ジオハッシュ集計です。このタイプの集計の場合、使用するインデックスには、geopointタイプのフィールドが必要です。ジオポイントは、緯度と経度の組み合わせです。
Kibana開発ツールを使用してインデックスを作成し、それにバルクデータを追加します。マッピングを追加し、必要なgeo_pointタイプを追加します。
使用するデータをここに示します-
{"index":{"_id":1}}
{"location": "2.089330000000046,41.47367000000008", "city": "SantCugat"}
{"index":{"_id":2}}
{"location": "2.2947825000000677,41.601800991000076", "city": "Granollers"}
{"index":{"_id":3}}
{"location": "2.1105957495300474,41.5496295760424", "city": "Sabadell"}
{"index":{"_id":4}}
{"location": "2.132605678083895,41.5370461908878", "city": "Barbera"}
{"index":{"_id":5}}
{"location": "2.151270020052683,41.497779918345415", "city": "Cerdanyola"}
{"index":{"_id":6}}
{"location": "2.1364609496220606,41.371303520399344", "city": "Barcelona"}
{"index":{"_id":7}}
{"location": "2.0819450306711165,41.385491966414705", "city": "Sant Just Desvern"}
{"index":{"_id":8}}
{"location": "2.00532082278266,41.542294286427385", "city": "Rubi"}
{"index":{"_id":9}}
{"location": "1.9560805366930398,41.56142635214226", "city": "Viladecavalls"}
{"index":{"_id":10}}
{"location": "2.09205348251486,41.39327140161001", "city": "Esplugas de Llobregat"}
次に、以下に示すように、Kibana DevToolsで次のコマンドを実行します-
PUT /cities
{
   "mappings": {
      "_doc": {
         "properties": {
            "location": {
               "type": "geo_point"
            }
         }
      }
   }
}

POST /cities/_city/_bulk?refresh
{"index":{"_id":1}}
{"location": "2.089330000000046,41.47367000000008", "city": "SantCugat"}
{"index":{"_id":2}}
{"location": "2.2947825000000677,41.601800991000076", "city": "Granollers"}
{"index":{"_id":3}}
{"location": "2.1105957495300474,41.5496295760424", "city": "Sabadell"}
{"index":{"_id":4}}
{"location": "2.132605678083895,41.5370461908878", "city": "Barbera"}
{"index":{"_id":5}}
{"location": "2.151270020052683,41.497779918345415", "city": "Cerdanyola"}
{"index":{"_id":6}}
{"location": "2.1364609496220606,41.371303520399344", "city": "Barcelona"}
{"index":{"_id":7}}
{"location": "2.0819450306711165,41.385491966414705", "city": "Sant Just Desvern"}
{"index":{"_id":8}}
{"location": "2.00532082278266,41.542294286427385", "city": "Rubi"}
{"index":{"_id":9}}
{"location": "1.9560805366930398,41.56142635214226", "city": "Viladecavalls"}
{"index":{"_id":10}}
{"location": "2.09205348251486,41.3s9327140161001", "city": "Esplugas de Llobregat"}
ここで、Kibana開発ツールで上記のコマンドを実行します-
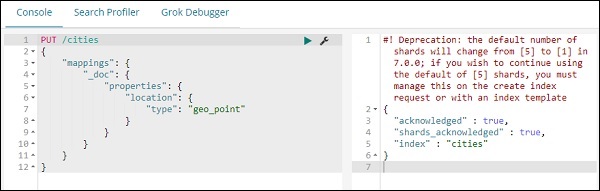
上記は、タイプ_docのインデックス名citysを作成し、フィールドの場所はタイプgeo_pointです。
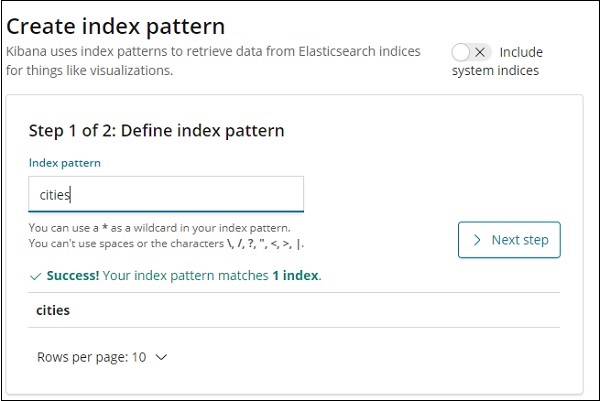
次に、インデックスにデータを追加しましょう:都市-

データを使用してインデックス名の引用を作成しました。次に、[管理]タブを使用して都市のインデックスパターンを作成しましょう。
都市インデックス内のフィールドの詳細をここに示します-
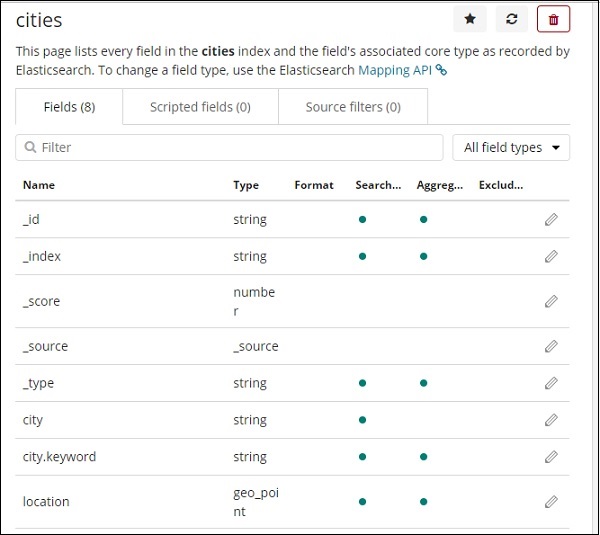
場所のタイプがgeo_pointであることがわかります。これを使用して視覚化を作成できます。
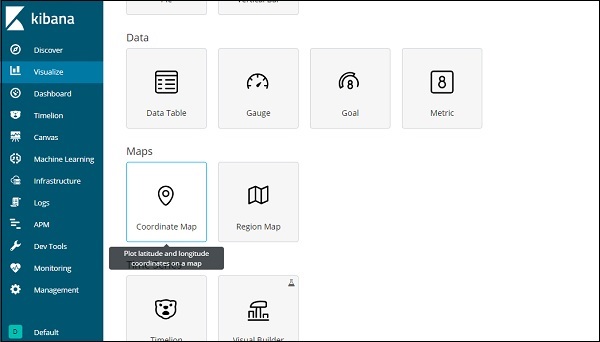
座標マップ入門
視覚化に移動し、座標マップを選択します。
インデックスパターンの都市を選択し、以下に示すように集約メトリックとバケットを構成します-

[分析]ボタンをクリックすると、次の画面が表示されます-
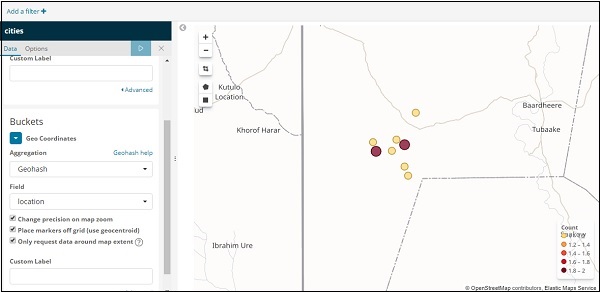
経度と緯度に基づいて、円は上記のようにマップ上にプロットされます。