โบเก้ - ColumnDataSource
วิธีการลงจุดส่วนใหญ่ใน Bokeh API สามารถรับพารามิเตอร์แหล่งข้อมูลผ่านอ็อบเจ็กต์ ColumnDatasource ทำให้แบ่งปันข้อมูลระหว่างพล็อตและ 'DataTables'
ColumnDatasource ถือได้ว่าเป็นการแมประหว่างชื่อคอลัมน์และรายการข้อมูล วัตถุ Python dict ที่มีสตริงคีย์และรายการหรืออาร์เรย์ numpy อย่างน้อยหนึ่งรายการเมื่อค่าถูกส่งไปยังตัวสร้าง ColumnDataSource
ตัวอย่าง
ด้านล่างนี้คือตัวอย่าง
from bokeh.models import ColumnDataSource
data = {'x':[1, 4, 3, 2, 5],
   'y':[6, 5, 2, 4, 7]}
cds = ColumnDataSource(data = data)
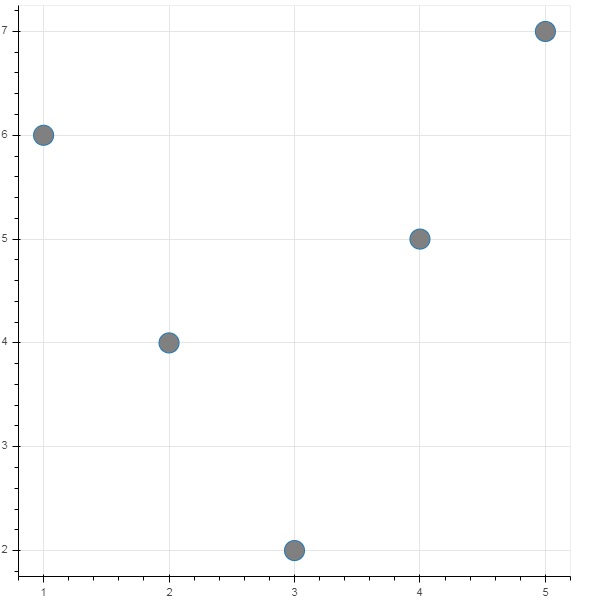
จากนั้นวัตถุนี้จะถูกใช้เป็นค่าของคุณสมบัติต้นทางในวิธีสัญลักษณ์ โค้ดต่อไปนี้สร้างพล็อตกระจายโดยใช้ ColumnDataSource
from bokeh.plotting import figure, output_file, show
from bokeh.models import ColumnDataSource
data = {'x':[1, 4, 3, 2, 5],
   'y':[6, 5, 2, 4, 7]}
cds = ColumnDataSource(data = data)
fig = figure()
fig.scatter(x = 'x', y = 'y',source = cds, marker = "circle", size = 20, fill_color = "grey")
show(fig)
เอาต์พุต

แทนที่จะกำหนดพจนานุกรม Python ให้กับ ColumnDataSource เราสามารถใช้ Pandas DataFrame ได้
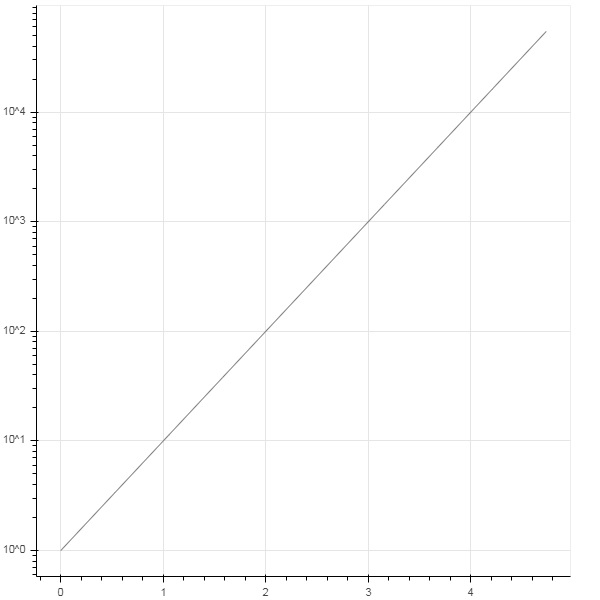
ให้เราใช้ 'test.csv' (ใช้ก่อนหน้านี้ในส่วนนี้) เพื่อรับ DataFrame และใช้สำหรับรับ ColumnDataSource และการแสดงผลพล็อตบรรทัด
from bokeh.plotting import figure, output_file, show
import pandas as pd
from bokeh.models import ColumnDataSource
df = pd.read_csv('test.csv')
cds = ColumnDataSource(df)
fig = figure(y_axis_type = 'log')
fig.line(x = 'x', y = 'pow',source = cds, line_color = "grey")
show(fig)
เอาต์พุต
