Bokeh - การพัฒนาด้วย JavaScript
ไลบรารี Bokeh Python และไลบรารีสำหรับภาษาอื่น ๆ เช่น R, Scala และ Julia ส่วนใหญ่โต้ตอบกับ BokehJS ในระดับสูง โปรแกรมเมอร์ Python ไม่ต้องกังวลเกี่ยวกับ JavaScript หรือการพัฒนาเว็บ อย่างไรก็ตามเราสามารถใช้ BokehJS API เพื่อพัฒนา JavaScript โดยใช้ BokehJS ได้โดยตรง
วัตถุ BokehJS เช่นร่ายมนตร์และวิดเจ็ตถูกสร้างขึ้นมากหรือน้อยเช่นเดียวกับใน Bokeh Python API โดยทั่วไป Python ClassName ใด ๆ จะมีให้ในรูปแบบBokeh.ClassNameจาก JavaScript ตัวอย่างเช่นวัตถุ Range1d ที่ได้รับใน Python
xrange = Range1d(start=-0.5, end=20.5)ได้รับเทียบเท่ากับ BokehJS เป็น -
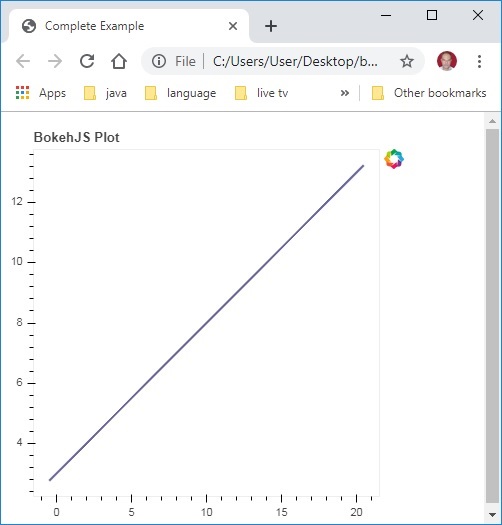
var xrange = new Bokeh.Range1d({ start: -0.5, end: 20.5 });ตามโค้ด JavaScript เมื่อฝังอยู่ในไฟล์ HTML จะแสดงพล็อตบรรทัดอย่างง่ายในเบราว์เซอร์
ขั้นแรกให้รวมไลบรารี BokehJS ทั้งหมดไว้ใน <head> .. </head> secion ของหน้าเว็บดังต่อไปนี้
<head>
<script type="text/javascript" src="https://cdn.pydata.org/bokeh/release/bokeh-1.3.4.min.js"></script>
<script type="text/javascript" src="https://cdn.pydata.org/bokeh/release/bokeh-widgets-1.3.4.min.js"></script>
<script type="text/javascript" src="https://cdn.pydata.org/bokeh/release/bokeh-tables-1.3.4.min.js"></script>
<script type="text/javascript" src="https://cdn.pydata.org/bokeh/release/bokeh-gl-1.3.4.min.js"></script>
<script type="text/javascript" src="https://cdn.pydata.org/bokeh/release/bokeh-api-1.3.4.min.js"></script>
<script type="text/javascript" src="https://cdn.pydata.org/bokeh/release/bokeh-api-1.3.4.min.js"></script>
</head>
ในส่วนเนื้อหาต่อจากส่วนย่อยของ JavaScript จะสร้างส่วนต่างๆของ Bokeh Plot
<script>
// create some data and a ColumnDataSource
var x = Bokeh.LinAlg.linspace(-0.5, 20.5, 10);
var y = x.map(function (v) { return v * 0.5 + 3.0; });
var source = new Bokeh.ColumnDataSource({ data: { x: x, y: y } });
// make the plot
var plot = new Bokeh.Plot({
   title: "BokehJS Plot",
   plot_width: 400,
   plot_height: 400
});

// add axes to the plot
var xaxis = new Bokeh.LinearAxis({ axis_line_color: null });
var yaxis = new Bokeh.LinearAxis({ axis_line_color: null });
plot.add_layout(xaxis, "below");
plot.add_layout(yaxis, "left");

// add a Line glyph
var line = new Bokeh.Line({
   x: { field: "x" },
   y: { field: "y" },
   line_color: "#666699",
   line_width: 2
});
plot.add_glyph(line, source);

Bokeh.Plotting.show(plot);
</script>
บันทึกโค้ดด้านบนเป็นหน้าเว็บและเปิดในเบราว์เซอร์ที่คุณเลือก
