Bokeh - Entwickeln mit JavaScript
Die Bokeh Python-Bibliothek und Bibliotheken für andere Sprachen wie R, Scala und Julia interagieren hauptsächlich auf hoher Ebene mit BokehJS. Ein Python-Programmierer muss sich nicht um JavaScript oder Webentwicklung kümmern. Man kann jedoch die BokehJS-API verwenden, um eine reine JavaScript-Entwicklung mit BokehJS direkt durchzuführen.
BokehJS-Objekte wie Glyphen und Widgets werden mehr oder weniger ähnlich wie in der Bokeh Python-API erstellt. Normalerweise ist jeder Python-Klassenname als verfügbarBokeh.ClassNamevon JavaScript. Zum Beispiel ein Range1d-Objekt, wie es in Python erhalten wurde.
xrange = Range1d(start=-0.5, end=20.5)Es wird äquivalent mit BokehJS als - erhalten
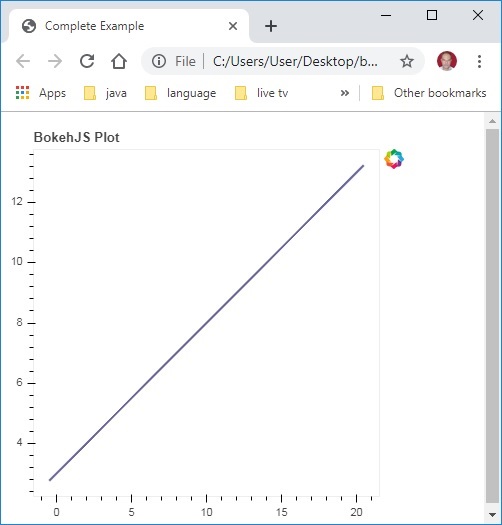
var xrange = new Bokeh.Range1d({ start: -0.5, end: 20.5 });Wenn Sie dem in eine HTML-Datei eingebetteten JavaScript-Code folgen, wird im Browser ein einfaches Liniendiagramm erstellt.
Fügen Sie zunächst alle BokehJS-Bibliotheken in den folgenden Abschnitt <head> .. </ head> der Webseite ein
<head>
<script type="text/javascript" src="https://cdn.pydata.org/bokeh/release/bokeh-1.3.4.min.js"></script>
<script type="text/javascript" src="https://cdn.pydata.org/bokeh/release/bokeh-widgets-1.3.4.min.js"></script>
<script type="text/javascript" src="https://cdn.pydata.org/bokeh/release/bokeh-tables-1.3.4.min.js"></script>
<script type="text/javascript" src="https://cdn.pydata.org/bokeh/release/bokeh-gl-1.3.4.min.js"></script>
<script type="text/javascript" src="https://cdn.pydata.org/bokeh/release/bokeh-api-1.3.4.min.js"></script>
<script type="text/javascript" src="https://cdn.pydata.org/bokeh/release/bokeh-api-1.3.4.min.js"></script>
</head>
Im folgenden Body-Abschnitt werden verschiedene Teile eines Bokeh-Plots erstellt.
<script>
// create some data and a ColumnDataSource
var x = Bokeh.LinAlg.linspace(-0.5, 20.5, 10);
var y = x.map(function (v) { return v * 0.5 + 3.0; });
var source = new Bokeh.ColumnDataSource({ data: { x: x, y: y } });
// make the plot
var plot = new Bokeh.Plot({
   title: "BokehJS Plot",
   plot_width: 400,
   plot_height: 400
});

// add axes to the plot
var xaxis = new Bokeh.LinearAxis({ axis_line_color: null });
var yaxis = new Bokeh.LinearAxis({ axis_line_color: null });
plot.add_layout(xaxis, "below");
plot.add_layout(yaxis, "left");

// add a Line glyph
var line = new Bokeh.Line({
   x: { field: "x" },
   y: { field: "y" },
   line_color: "#666699",
   line_width: 2
});
plot.add_glyph(line, source);

Bokeh.Plotting.show(plot);
</script>
Speichern Sie den obigen Code als Webseite und öffnen Sie ihn in einem Browser Ihrer Wahl.
