Excel ขั้นสูง - การออกแบบแผนภูมิ
ริบบิ้นของเครื่องมือแผนภูมิ
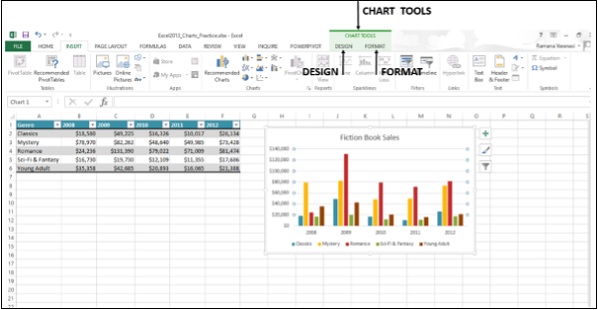
เมื่อคุณคลิกที่แผนภูมิของคุณไฟล์ CHART TOOLS ซึ่งประกอบด้วยแท็บ DESIGN และ FORMAT มีการแนะนำแท็บบน Ribbon
Step 1 - คลิกที่แผนภูมิ CHART TOOLS กับ DESIGN และ FORMAT แท็บจะแสดงบนริบบิ้น
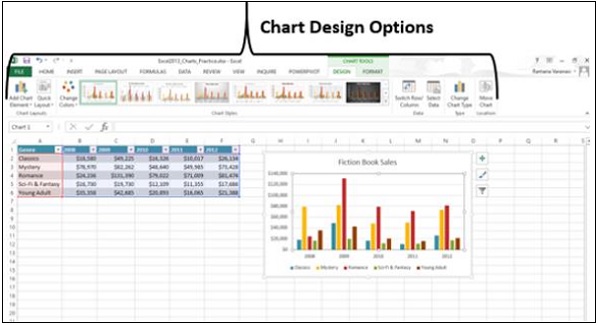
ให้เราเข้าใจการทำงานของไฟล์ DESIGN แท็บ
Step 1 - คลิกที่แผนภูมิ
Step 2 - คลิกที่ไฟล์ DESIGNแท็บ Ribbon ตอนนี้จะแสดงตัวเลือกทั้งหมดของ Chart Design.
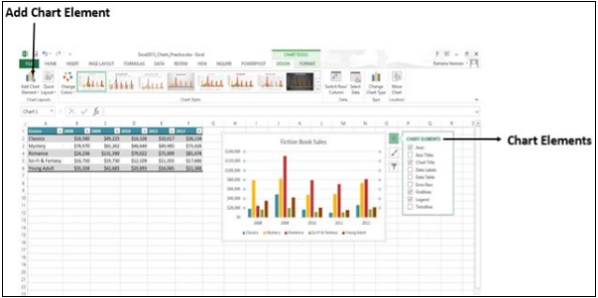
ปุ่มแรกบนริบบิ้นคือ Add Chart Elementซึ่งเหมือนกับไฟล์ Chart Elementsให้ไว้ที่มุมขวาบนของแผนภูมิดังที่แสดงด้านล่าง
เค้าโครงด่วน
คุณสามารถใช้เค้าโครงด่วนเพื่อเปลี่ยนเค้าโครงโดยรวมของแผนภูมิได้อย่างรวดเร็วโดยเลือกหนึ่งในตัวเลือกเค้าโครงที่กำหนดไว้ล่วงหน้า
Step 1- คลิกที่เค้าโครงด่วน เค้าโครงที่เป็นไปได้ต่างๆจะปรากฏขึ้น
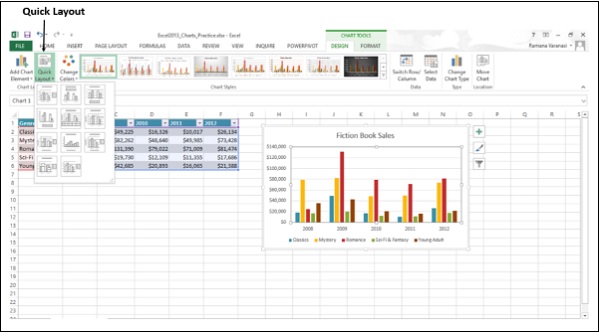
Step 2- ในขณะที่คุณเลื่อนตัวเลือกเค้าโครงเค้าโครงแผนภูมิจะเปลี่ยนเป็นตัวเลือกนั้น ๆ ตัวอย่างการแสดงแผนภูมิของคุณ
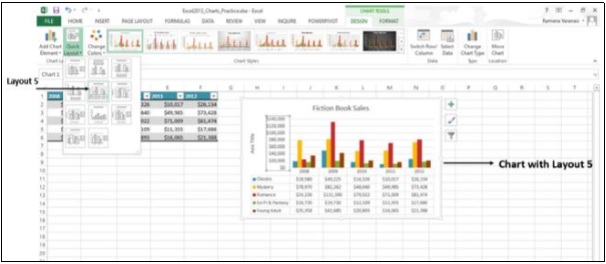
Step 3- คลิกที่เค้าโครงที่คุณต้องการ แผนภูมิจะแสดงพร้อมกับเค้าโครงที่เลือก
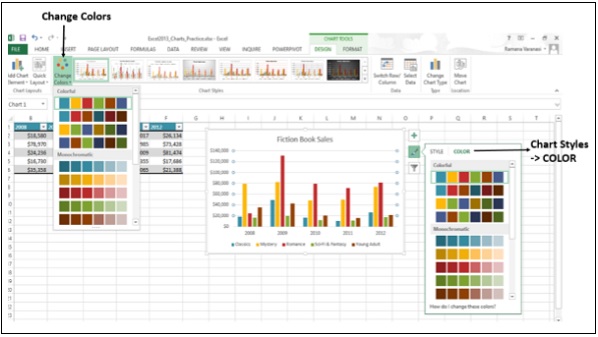
เปลี่ยนสี
Change Colors ตัวเลือกเหมือนกับใน CHART ELEMENTS → Change Styles → COLOR.
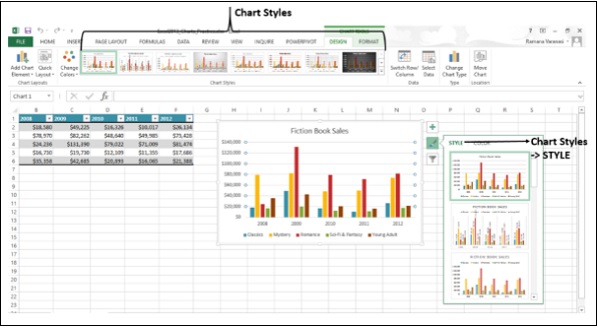
รูปแบบแผนภูมิ
ตัวเลือกสไตล์แผนภูมิจะเหมือนกับใน CHART ELEMENTS → Change Styles → STYLE.
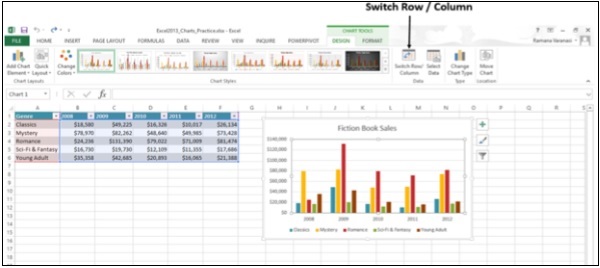
สลับแถว / คอลัมน์
คุณสามารถใช้ไฟล์ Switch Row / Columnบน Ribbon เพื่อเปลี่ยนการแสดงข้อมูลจากแกน X เป็นแกน Y และในทางกลับกัน ทำตามขั้นตอนด้านล่างเพื่อทำความเข้าใจสิ่งนี้
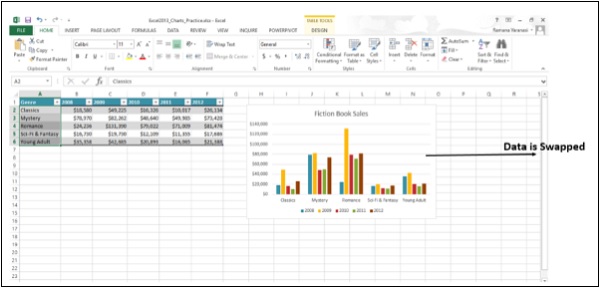
Step 1 - คลิกที่ Switch Row / Column. คุณจะเห็นว่าข้อมูลจะถูกสลับระหว่างแกน X และแกน Y
เลือกข้อมูล
คุณสามารถเปลี่ยนช่วงข้อมูลที่รวมอยู่ในแผนภูมิได้โดยใช้คำสั่งนี้
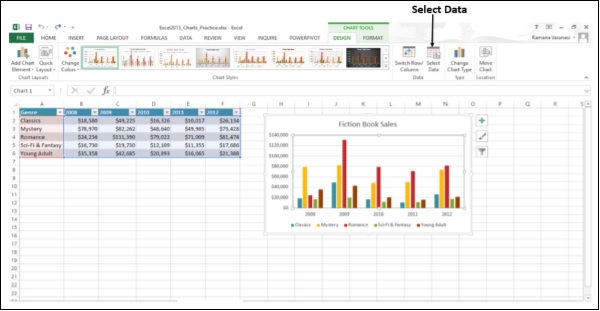
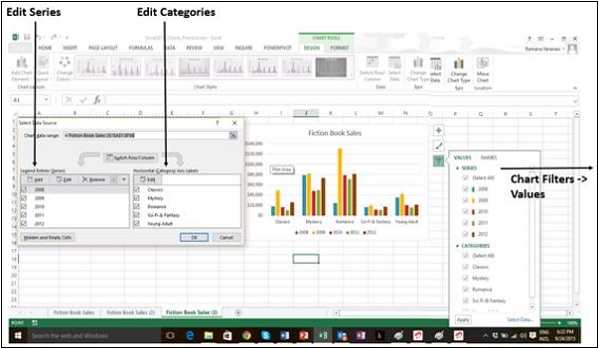
Step 1 - คลิกที่ Select Data. Select Data Source จะปรากฏขึ้นตามที่แสดงในภาพด้านล่าง
Step 2 - เลือกไฟล์ Chart Data Range.
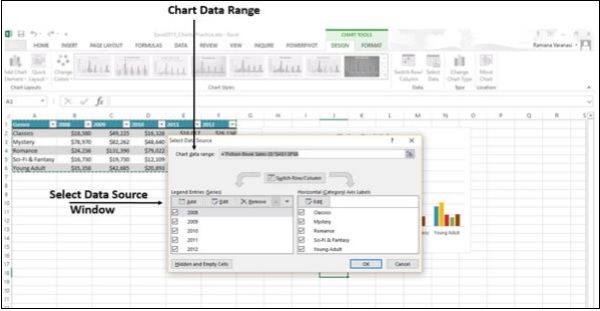
หน้าต่างยังมีตัวเลือกในการแก้ไขไฟล์ Legend Entries (Series) และ Categories. เช่นเดียวกับChart Elements → Chart Filters → VALUES.
เปลี่ยนประเภทแผนภูมิ
คุณสามารถเปลี่ยนเป็นไฟล์ Chart Type โดยใช้ตัวเลือกนี้
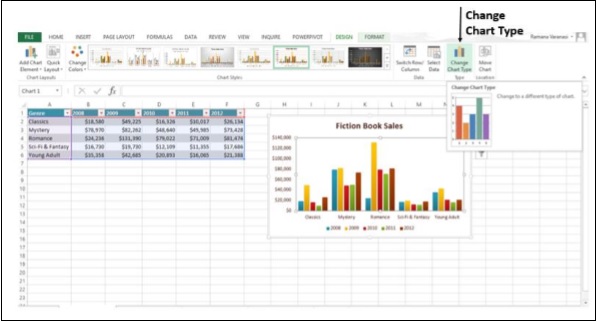
Step 1 - คลิกที่ไฟล์ Change Chart Typeหน้าต่าง. Change Chart Type หน้าต่างจะปรากฏขึ้น
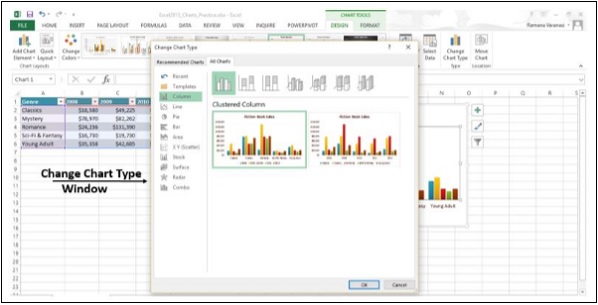
Step 2 - เลือกไฟล์ Chartพิมพ์ที่คุณต้องการ แผนภูมิจะแสดงพร้อมกับประเภทที่เลือก
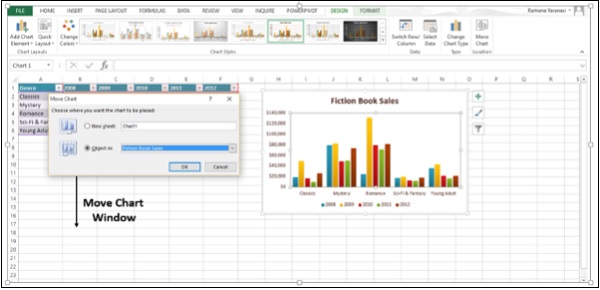
ย้ายแผนภูมิ
คุณสามารถย้ายแผนภูมิไปยังแผ่นงานอื่นในสมุดงานโดยใช้ตัวเลือกนี้
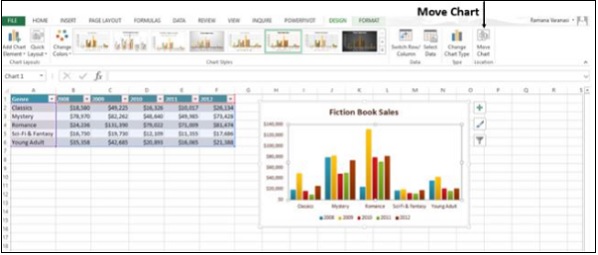
คลิกที่ Move Chart. Move Chart หน้าต่างจะปรากฏขึ้น