ボケ-注釈と凡例
注釈は、図に追加された説明テキストです。ボケプロットには、プロットタイトル、x軸とy軸のラベルを指定したり、プロット領域の任意の場所にテキストラベルを挿入したりすることで注釈を付けることができます。
プロットのタイトルとx軸およびy軸のラベルは、Figureコンストラクター自体で提供できます。
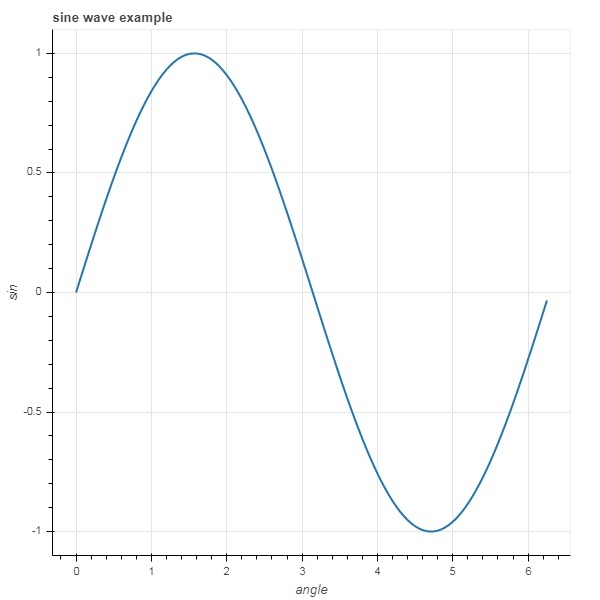
fig = figure(title, x_axis_label, y_axis_label)次のプロットでは、これらのプロパティは次のように設定されています。
from bokeh.plotting import figure, output_file, show
import numpy as np
import math
x = np.arange(0, math.pi*2, 0.05)
y = np.sin(x)
fig = figure(title = "sine wave example", x_axis_label = 'angle', y_axis_label = 'sin')
fig.line(x, y,line_width = 2)
show(p)
出力

タイトルのテキストと軸のラベルは、Figureオブジェクトの対応するプロパティに適切な文字列値を割り当てることによって指定することもできます。
fig.title.text = "sine wave example"
fig.xaxis.axis_label = 'angle'
fig.yaxis.axis_label = 'sin'
タイトルの場所、配置、フォント、色を指定することもできます。
fig.title.align = "right"
fig.title.text_color = "orange"
fig.title.text_font_size = "25px"
fig.title.background_fill_color = "blue"
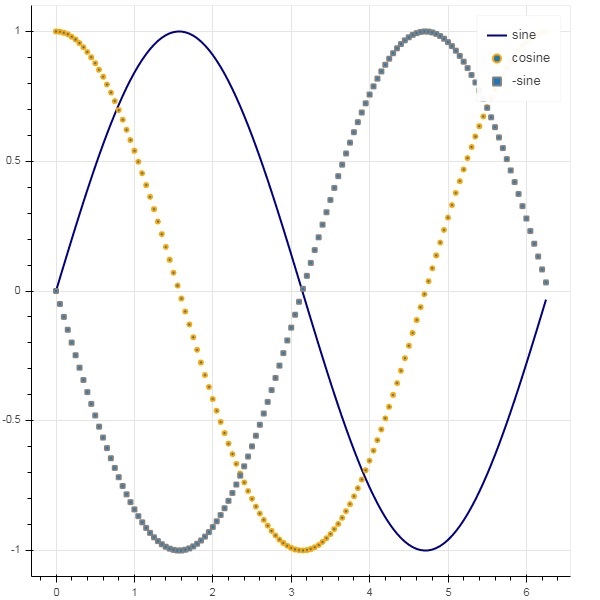
プロット図に凡例を追加するのは非常に簡単です。グリフメソッドの凡例プロパティを使用する必要があります。
以下に、3つの異なる凡例を持つ3つのグリフ曲線がプロットにあります-
from bokeh.plotting import figure, output_file, show
import numpy as np
import math
x = np.arange(0, math.pi*2, 0.05)
fig = figure()
fig.line(x, np.sin(x),line_width = 2, line_color = 'navy', legend = 'sine')
fig.circle(x,np.cos(x), line_width = 2, line_color = 'orange', legend = 'cosine')
fig.square(x,-np.sin(x),line_width = 2, line_color = 'grey', legend = '-sine')
show(fig)
出力
